- You are here:
- Home »
- Blog »
- Power BI »
- Power BI Business Narration

Power BI Business Narration
(G Com Solutions provide Power BI Training in London and throughout the UK.)
Power BI reports can be very detailed and consist of many pages. Inevitably, there will be particular insights which it is important that consumers of the report do not miss. In the Power BI world, business narration means taking a journalistic approach to report creation and drawing the attention of your audience to key aspects of the data; in other words, ensuring that everyone is made aware of the most important points. In this blog post, we will examine some of the key aspects of this style of Power BI reporting.
Narrative Formatting
The two features provided by Power BI which are most useful when taking this approach are probably bookmarks and the Selection pane. However, before we discuss these, let us review some of the visual formatting features that we can leverage when adding narration to our Power BI reports.
Customizing titles and headers
Titles and headers are displayed at the top of most visuals and are often automatically generated by Power BI. A typical Power BI automatically generated title might read: “Count of Units Sold by Product Range”.
When creating narrative reports, we can replace these titles with messages that convey some insight into the information communicated by the visual.
For example, in the illustration below, we are using the card visual to display a headline figure, instead of settling for the default category label “Count of Responses” with the more communicative “customers responded to our survey”.
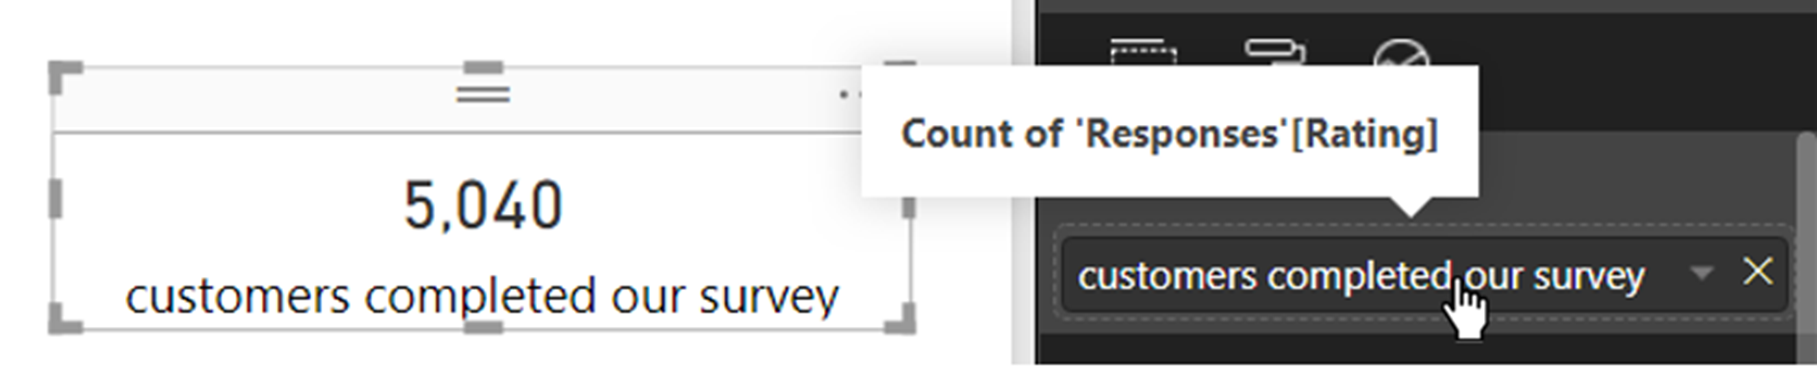
To change the content of the category label in the card visual, simply double-click on the default label displayed in the Field tab of the Visualization pane and type your replacement.
To change the title in any visual, click on the Format tab of the Visualization pane, expand the Title section and enter a new title in the Title Text field.
In the following illustration, we can see two customized titles on bar chart visuals.
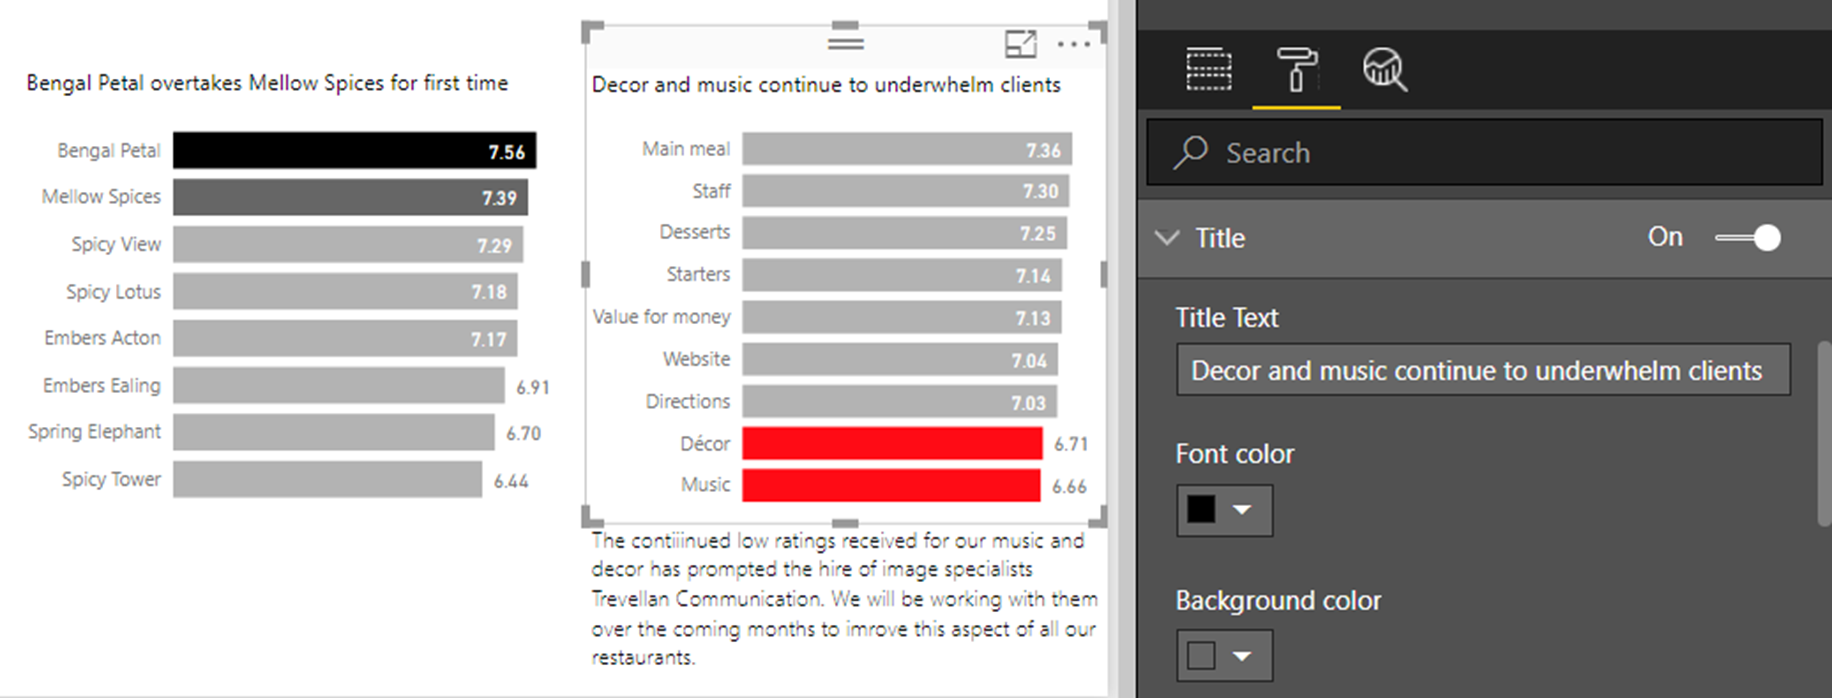
Below the visual on the right, we also have a text box which gives further information to expand on the message conveyed by the title.
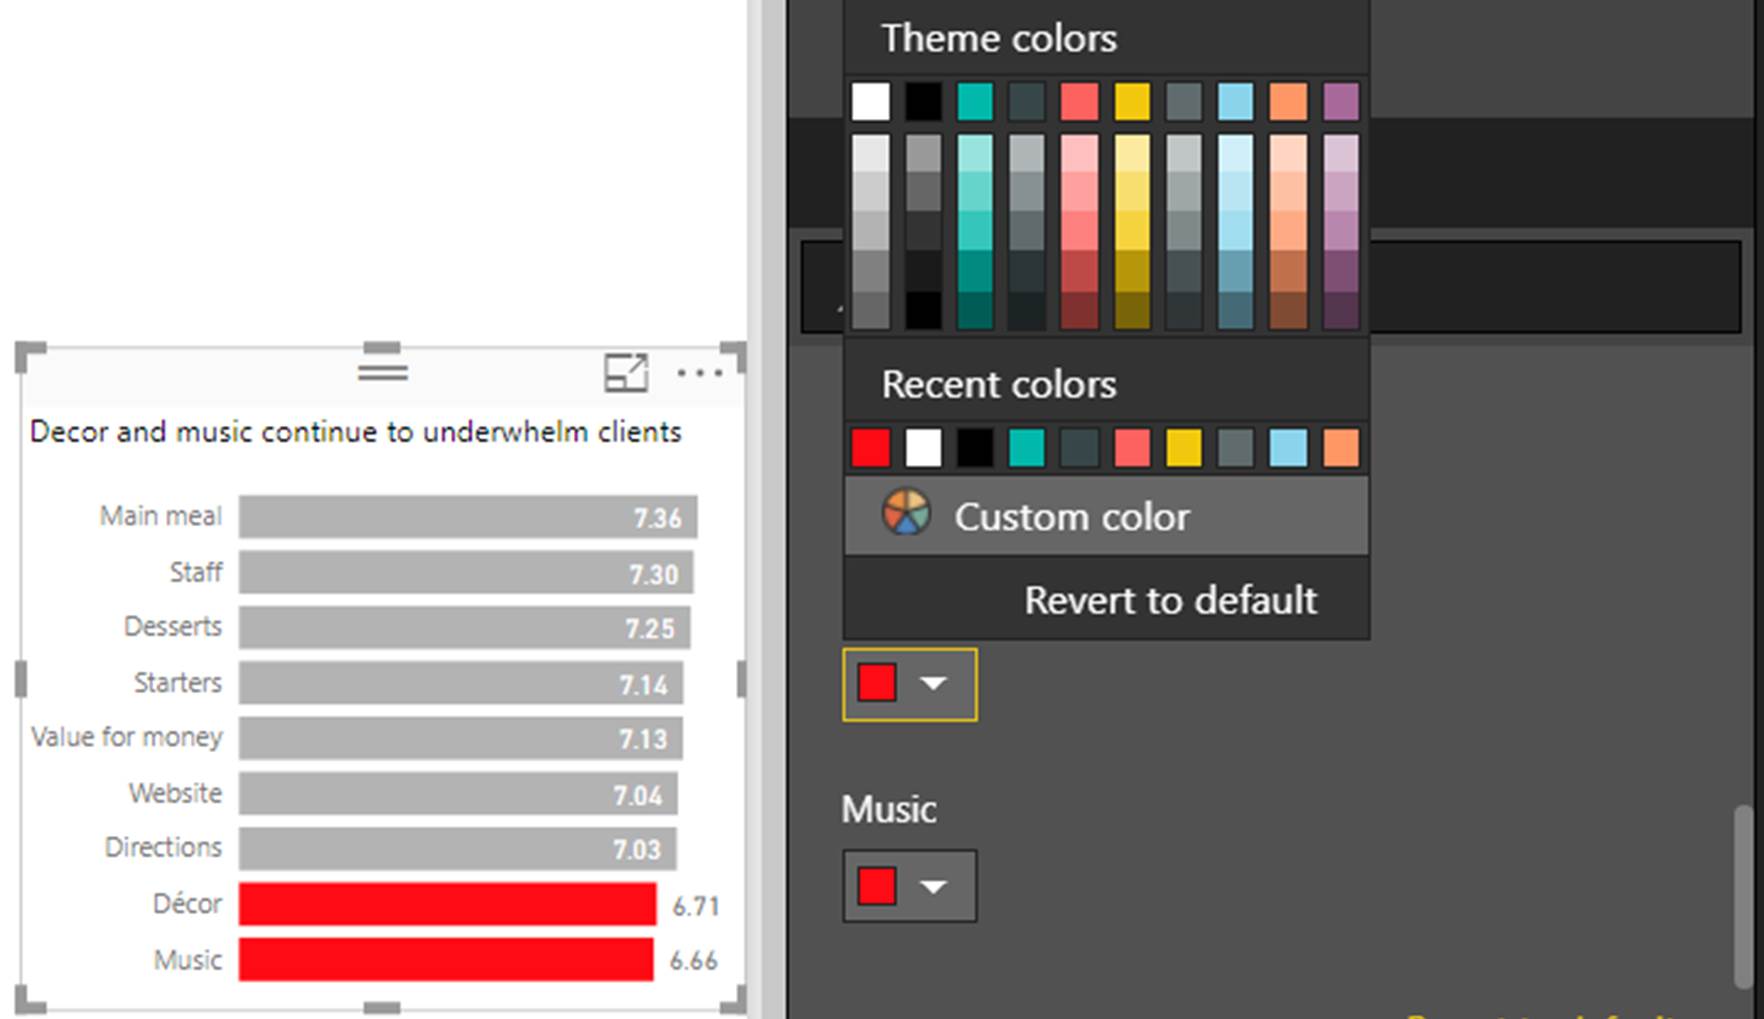
Customizing colours
Whenever a visual is created, Power BI will automatically assign colours to the various elements within the visual. As well as changing these colours for branding and aesthetic purposes, it is possible to choose colours convey a specific message.
For example, in the illustration above, we have changed the colour of the bars representing the Décor and Music categories to red. This is to highlight the fact that their poor rating is cause for concern.
To change the colours of individual elements within a visual, expand the Data Colors section of the Format tab of the Visualizations pane. Next, activate the option Show All.
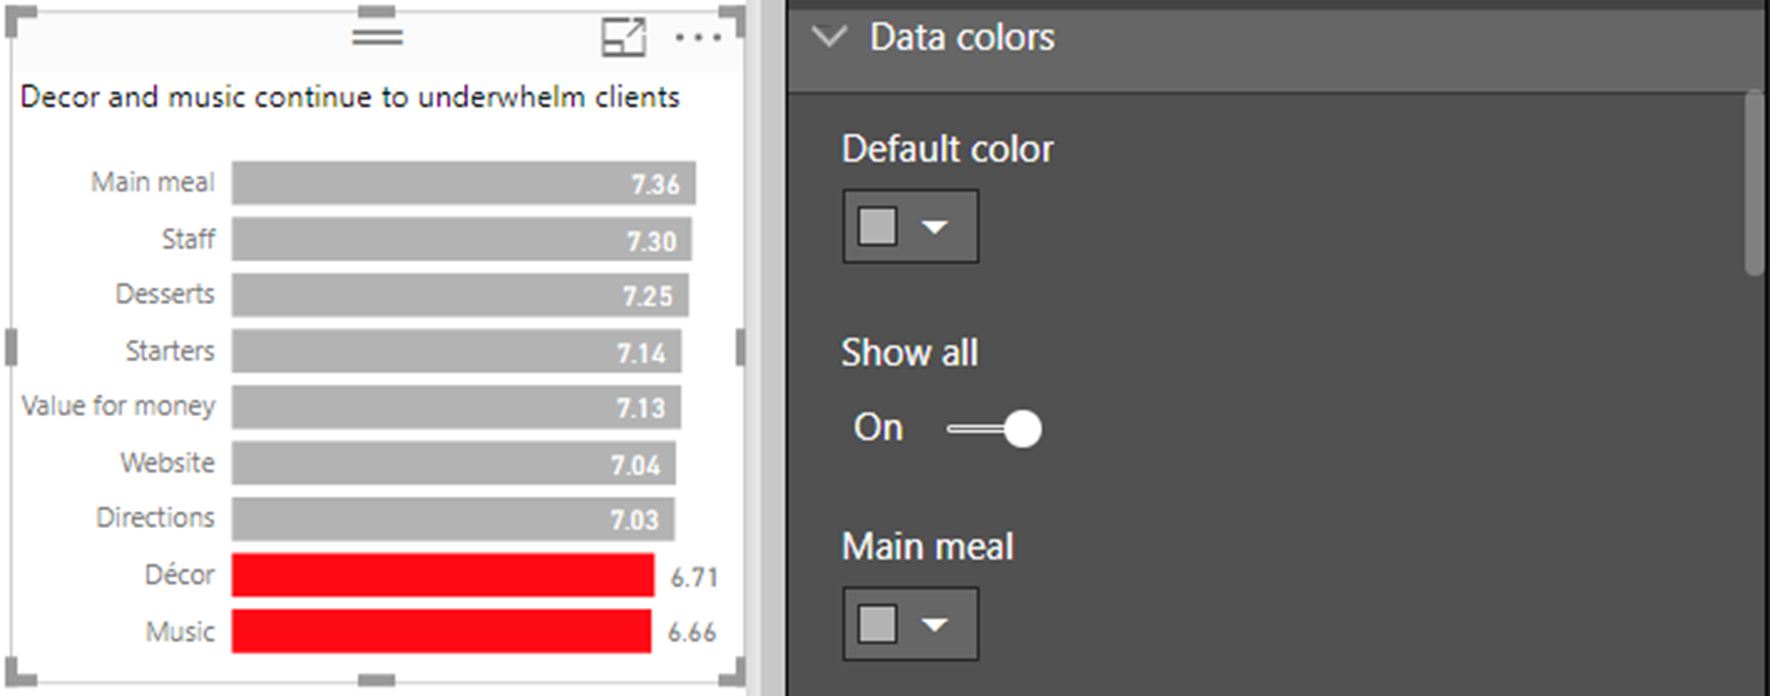
Each of the different elements in the category field will then be displayed with a drop-down allowing you to choose a colour.
Self-running narratives
Self-running narratives can be created In Power BI in three ways:
1. By creating a series of bookmarks and then playing them.
2. By saving exporting each page of a report as a PDF, combining all the PDF files into a single presentation and setting the presentation to open in full-screen mode.
3. By manually creating a narrative report in PowerPoint.
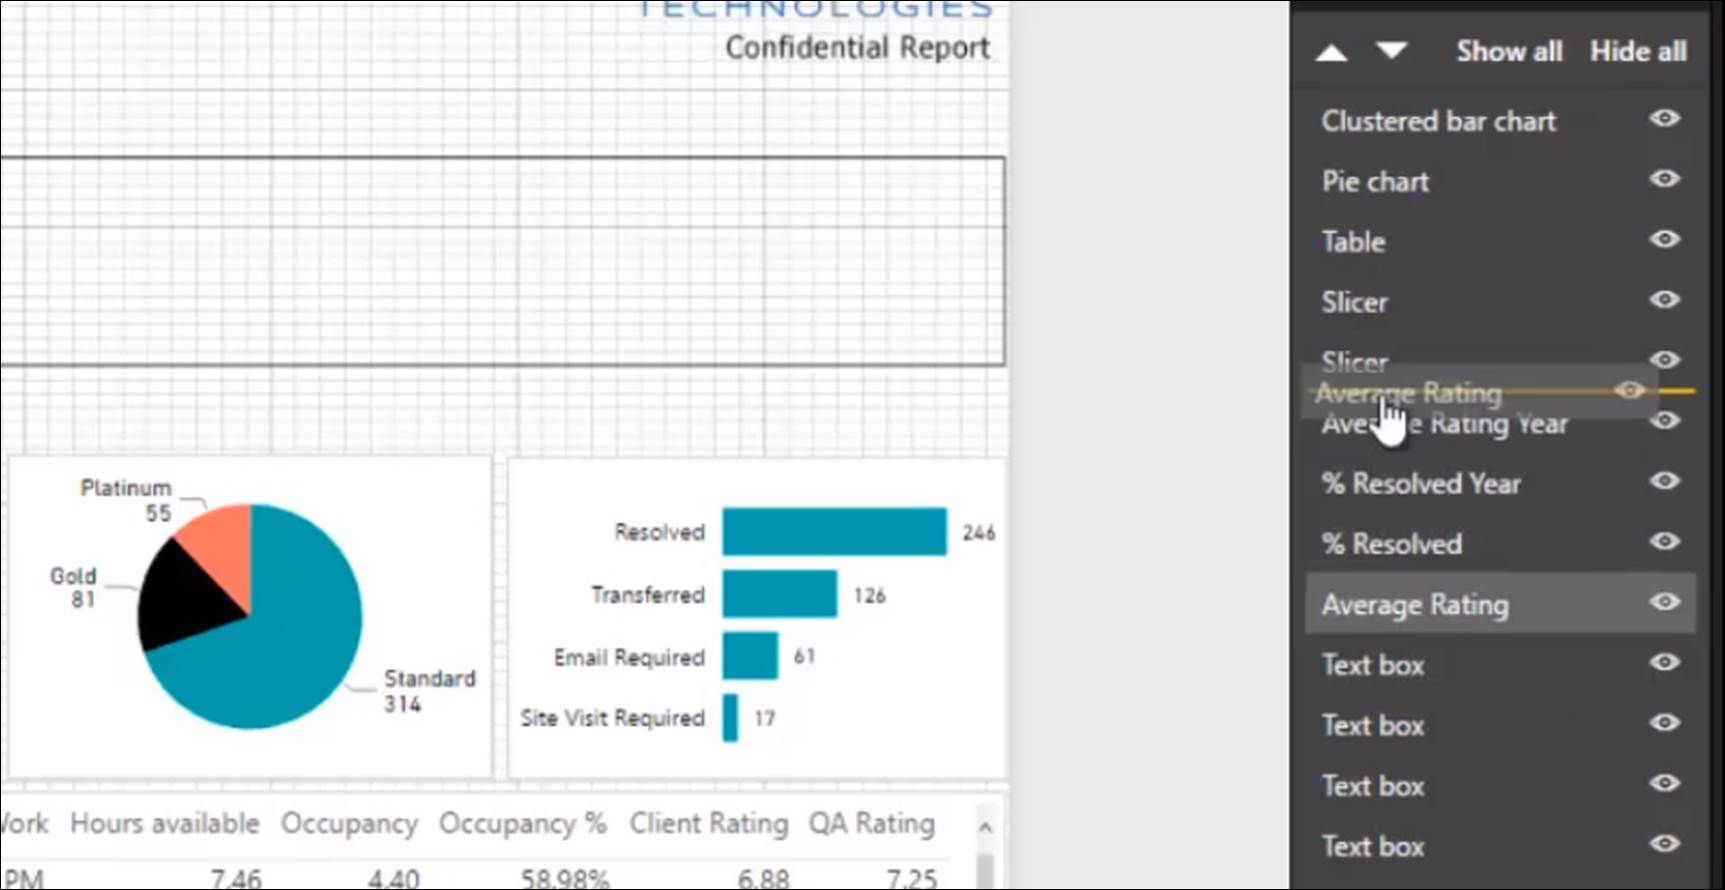
The Selection Pane
Interactive narratives in Power BI are created by using the features in two panels: Selection and Bookmarks.
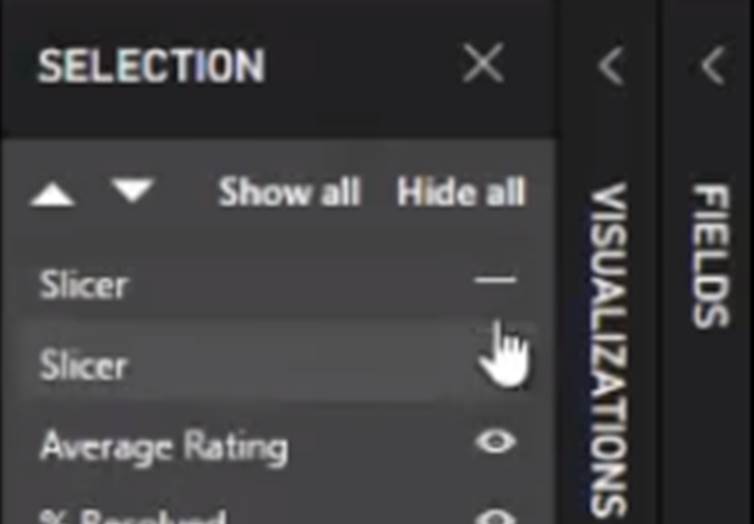
To make the Selection pane visible, click View > Show > Selection Pane. The Selection pane is used to control the visibility and stacking order of all the elements on a report page. As you add visuals and other content to a page, Power BI automatically assigns them names. Clicking a name in the Selection pane highlights the corresponding element on the page, and vice versa. (Note that names are not necessarily unique and, at the time of writing cannot be modified.)
The stacking order of elements can be changed by dragging the name of item up or down in the Selection pane.
Elements are in front of those elements listed below them in the Selection pane.
To hide or show an individual element, simply click on the visibility icon next to its name.
To globally hide or show elements, use the Show All and Hide All buttons.
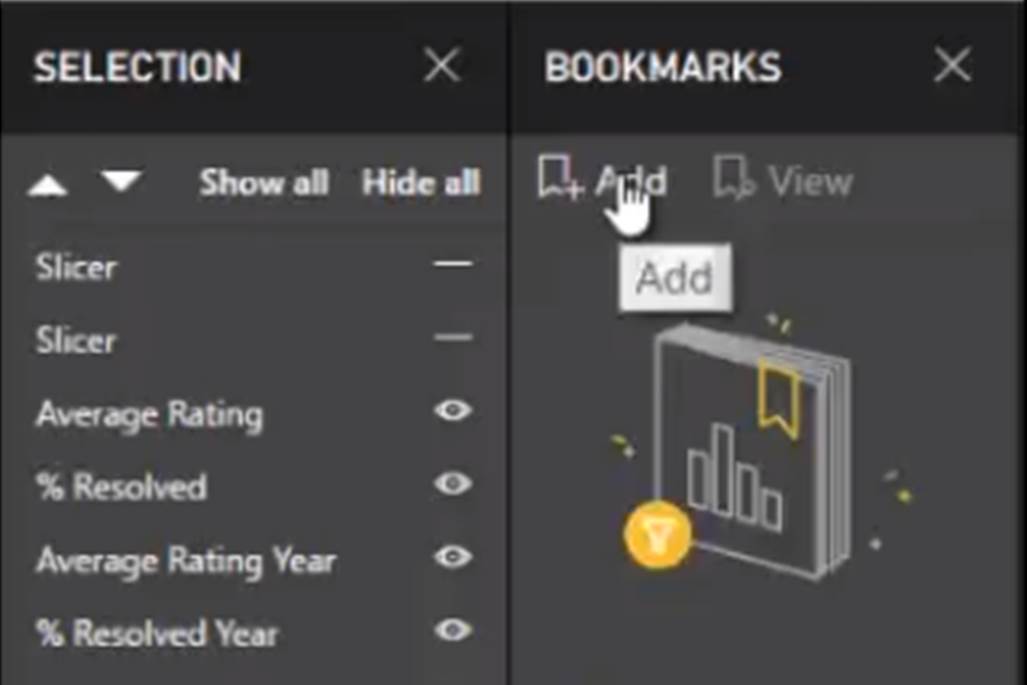
The Bookmarks pane (View > Show > Bookmarks Pane) is used in conjunction with the Selection pane. It allows you to save the currently visible elements and their state as a named bookmark. Activating that particular bookmark in the future restores all the elements and the state of each.
These are the attributes of an item which will be recorded whenever a bookmark is created:
· The page on which the item is located
· The visibility of each item on the page
· The sort order of each visual on the page
· Filters applied both the slicers and other visuals (including hidden ones)
· Selected items within any visual
· Cross-filter highlighting of a visual as a result of another item being selected
· The current drill-down state of each visual
· Whether the spotlight feature was applied to any visual
· Whether any visual is in focus mode.
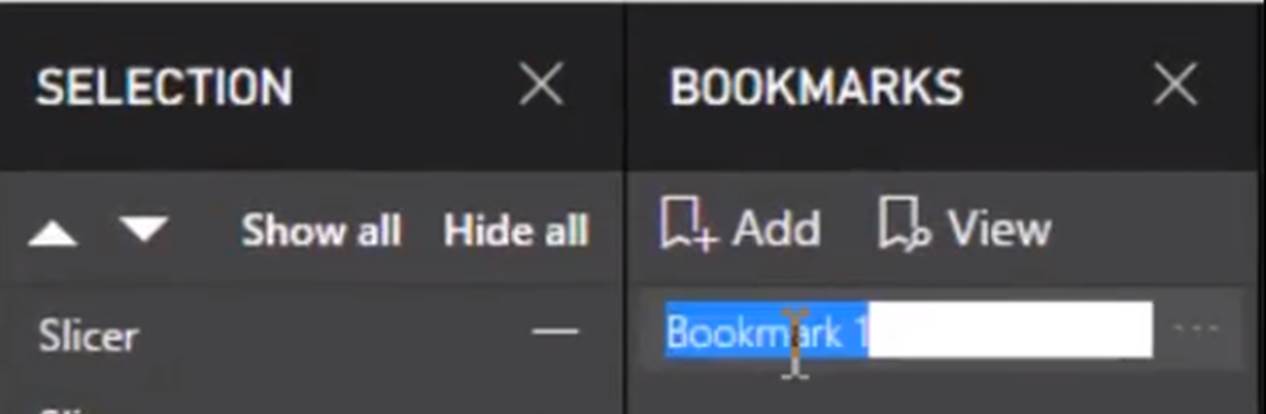
To create a bookmark, click on the Add button in the Bookmarks pane.
Power BI creates the bookmark and assigns it a default name, such as “Bookmark 1”. To rename a bookmark, simply double-click on the default name and enter a more meaningful one.
One of the quirks of bookmarks is that any item added after the creation of a bookmark will become visible whenever that bookmark is activated. This is one of the reasons why the need to update bookmarks is quite common. Fortunately, updating a bookmark is very easy: first, you make the necessary changes to the various aspects of the elements on the page, as outlined above; then, you click on the settings menu next to the bookmark (accessed by clicking on the ellipsis) and choose Update.
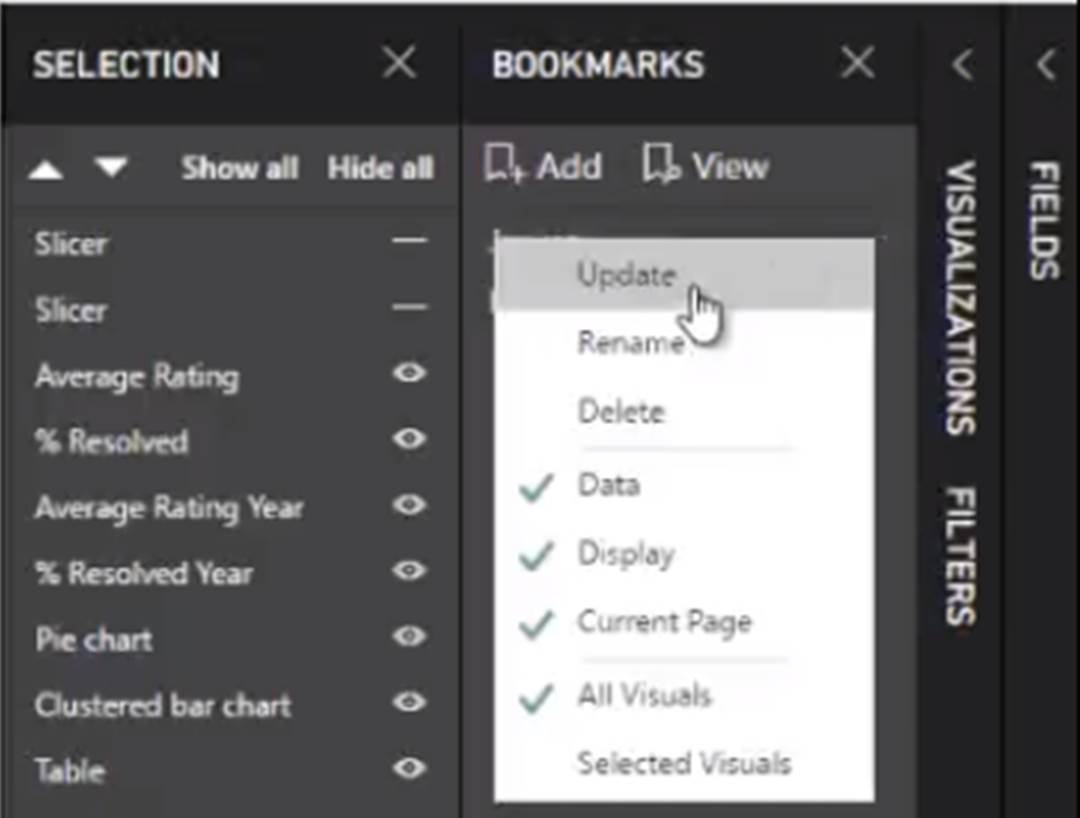
You will notice that the bookmark settings menu also allows you to override the default behaviour of a bookmark, by deactivating some of the attributes which are normally saved with a bookmark.
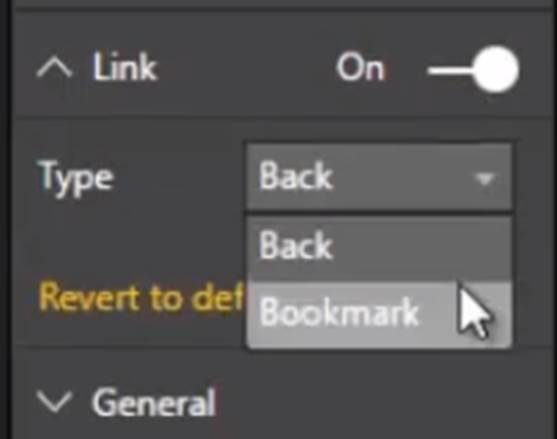
When a report is published, the user will not have access to the Bookmarks pane. So, we need to provide some alternative method of accessing bookmarks. We can use buttons, images or shapes.
To add a hyperlink to a button, shape or image, in the Format panel which appears whenever the item is selected, activate the Link option. Then, set the type to Bookmark and choose the appropriate bookmark from the pop-up menu.