- You are here:
- Home »
- Blog »
- Power BI »
- Power BI MCSA Certification Training Tips – Part 13: Analyze in Excel

Power BI MCSA Certification Training Tips – Part 13: Analyze in Excel
To obtain your MCSA: BI Reporting you need to pass two exams: 70-778 (Analyzing and Visualizing Data with Power BI) and 70-779 (Analyzing and Visualizing Data with Excel). However, there is a huge overlap between the two exams resulting from the common BI features found in both Power BI and Excel: namely data modelling using the DAX language; and data connection and transformation using the M language.
We, at G Com Solutions, recommend to the clients to whom we supply Power BI Training that they prepare for both exams simultaneously and then sit both exams on the same day. We also run a 5 day Power BI MCSA Certification Prep course in London which includes both exams 70-778 and 70-779.
In this series of blog posts, we will be examining some of the key features of Power BI, Power Pivot and Power Query which you will need to master in order to pass the two exams.
In this topic, which applies equally to exam 70-779, we will examine the Analyze in Excel feature found in the Power BI Service.
Excel’s Analyze in Excel feature requires a Power BI Pro license and generates an Excel report connected to a Power BI dataset. Changes in the dataset are reflected in the Excel report.
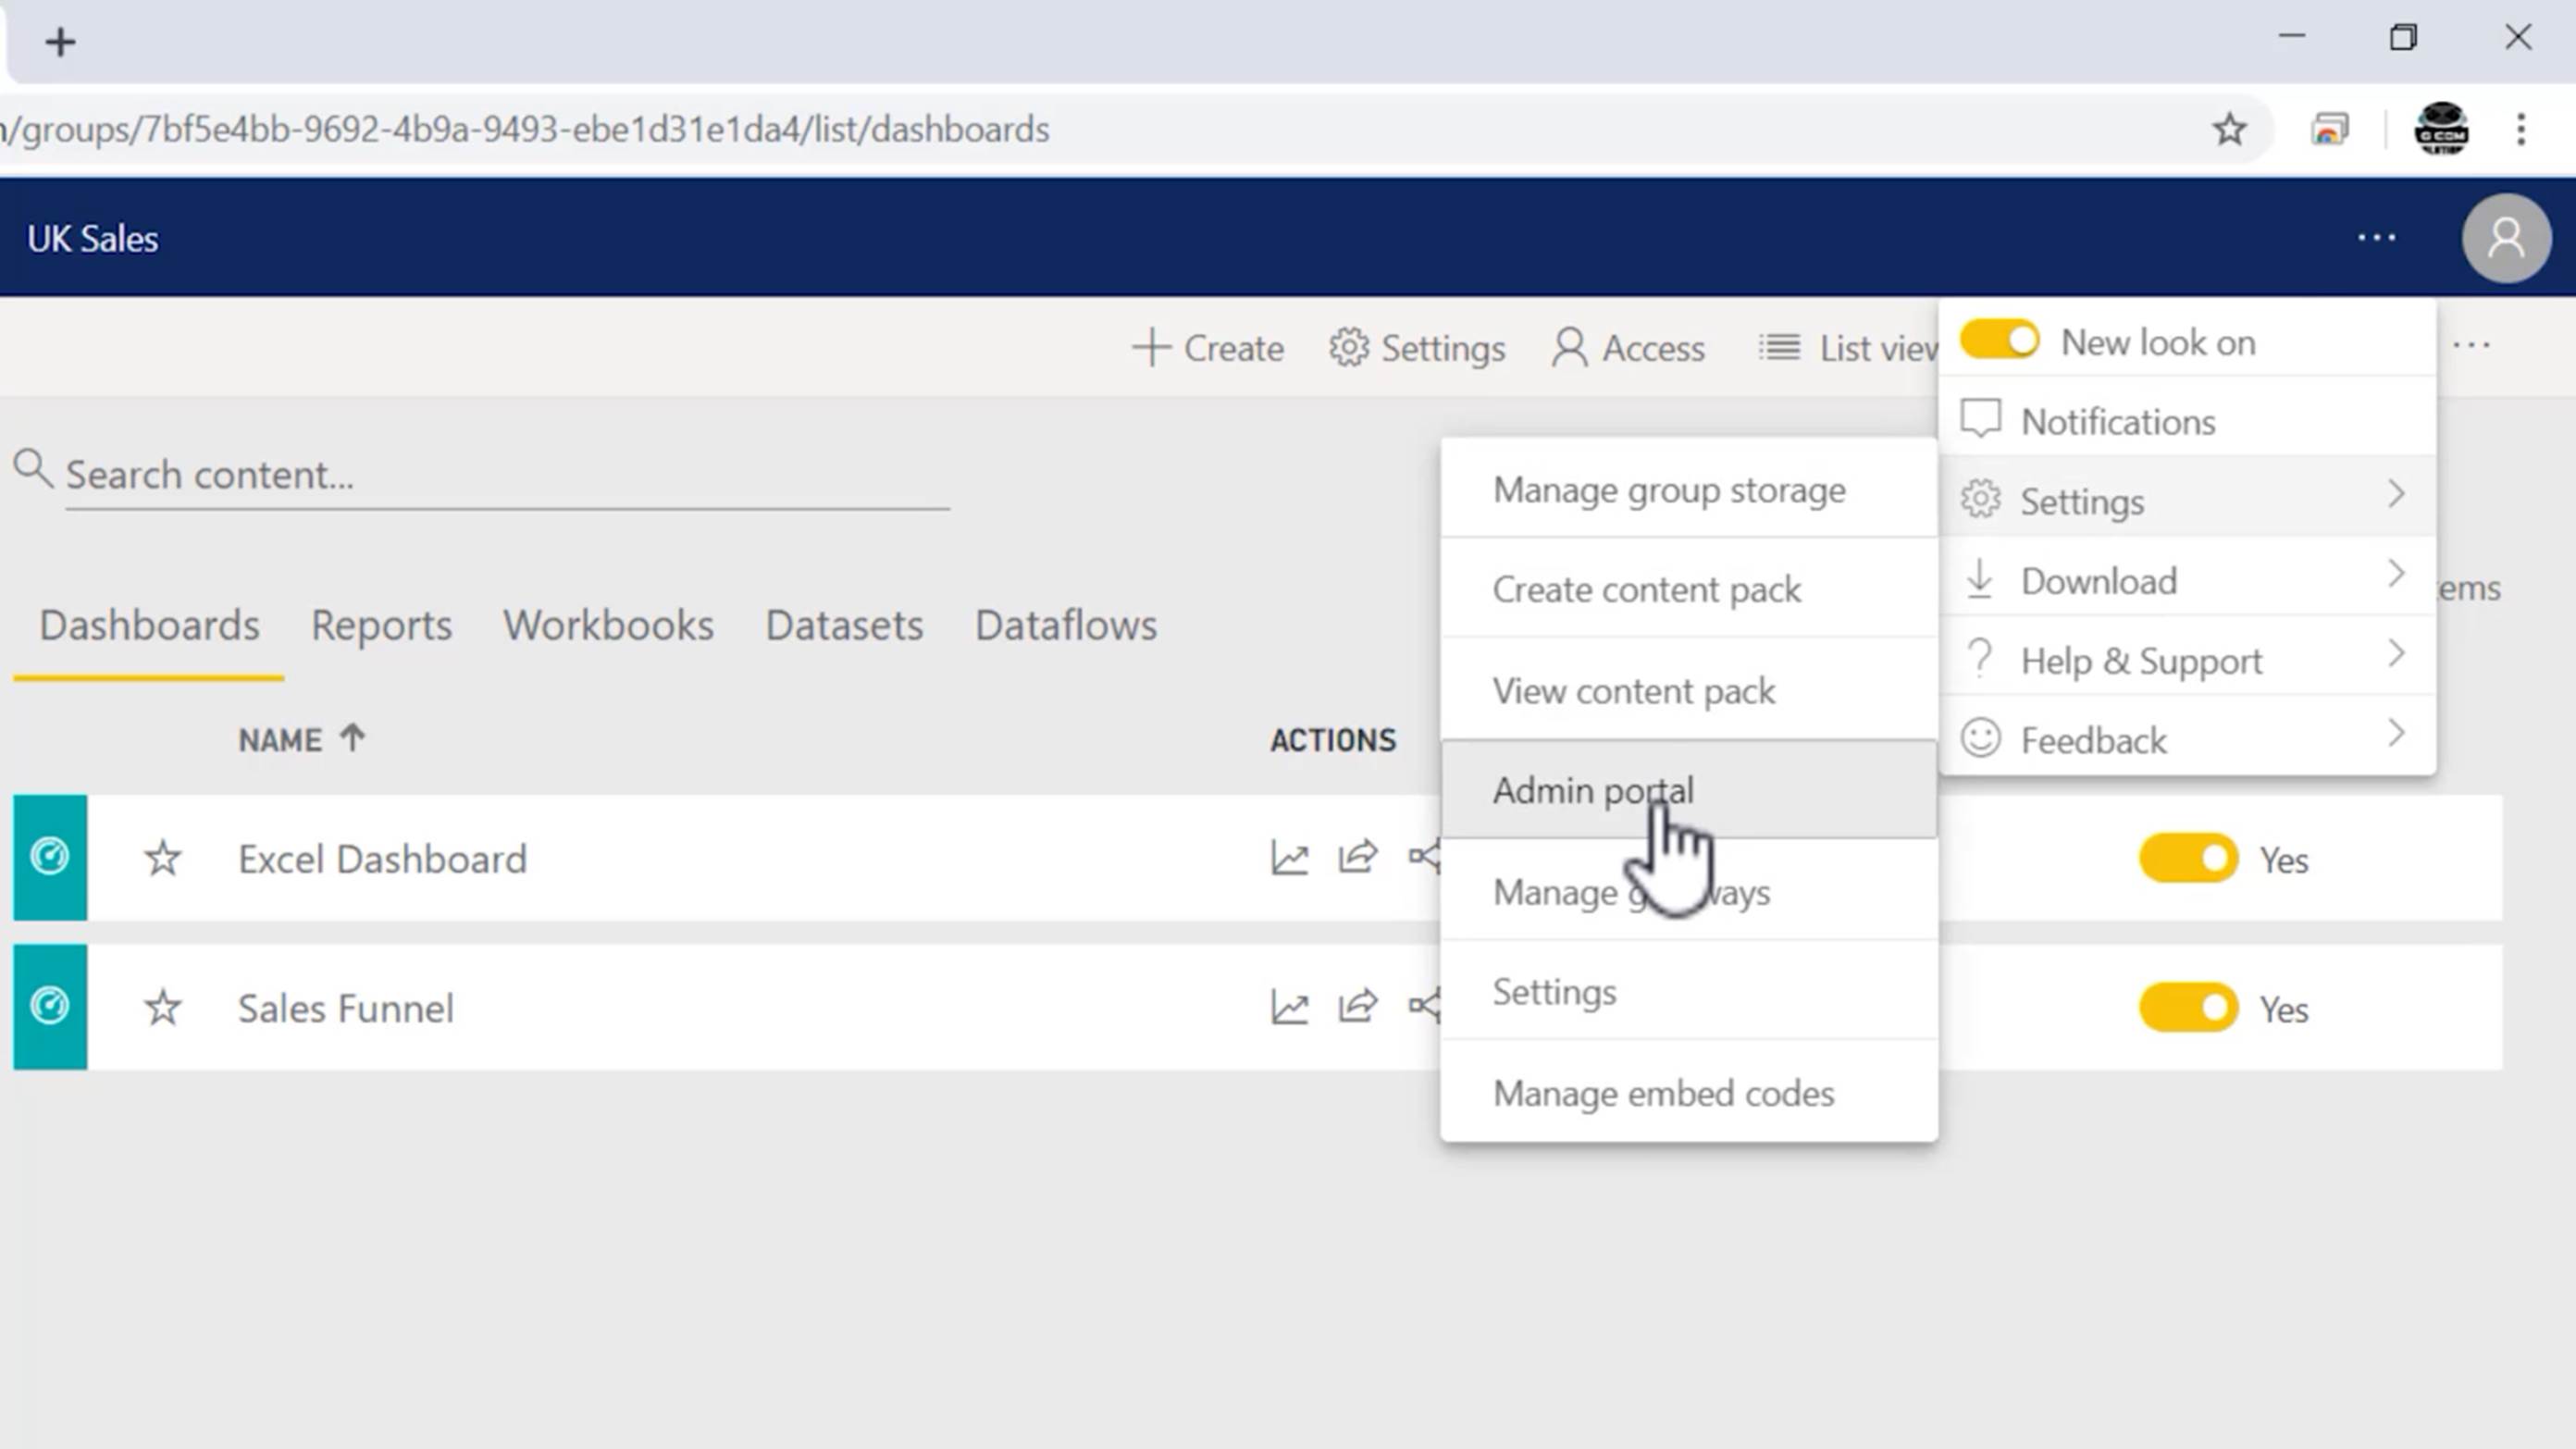
This feature can be disable or enabled at the administration level along with the ability to export data from report visuals. To activate the feature, in the Power BI service, click Settings > Admin Portal.
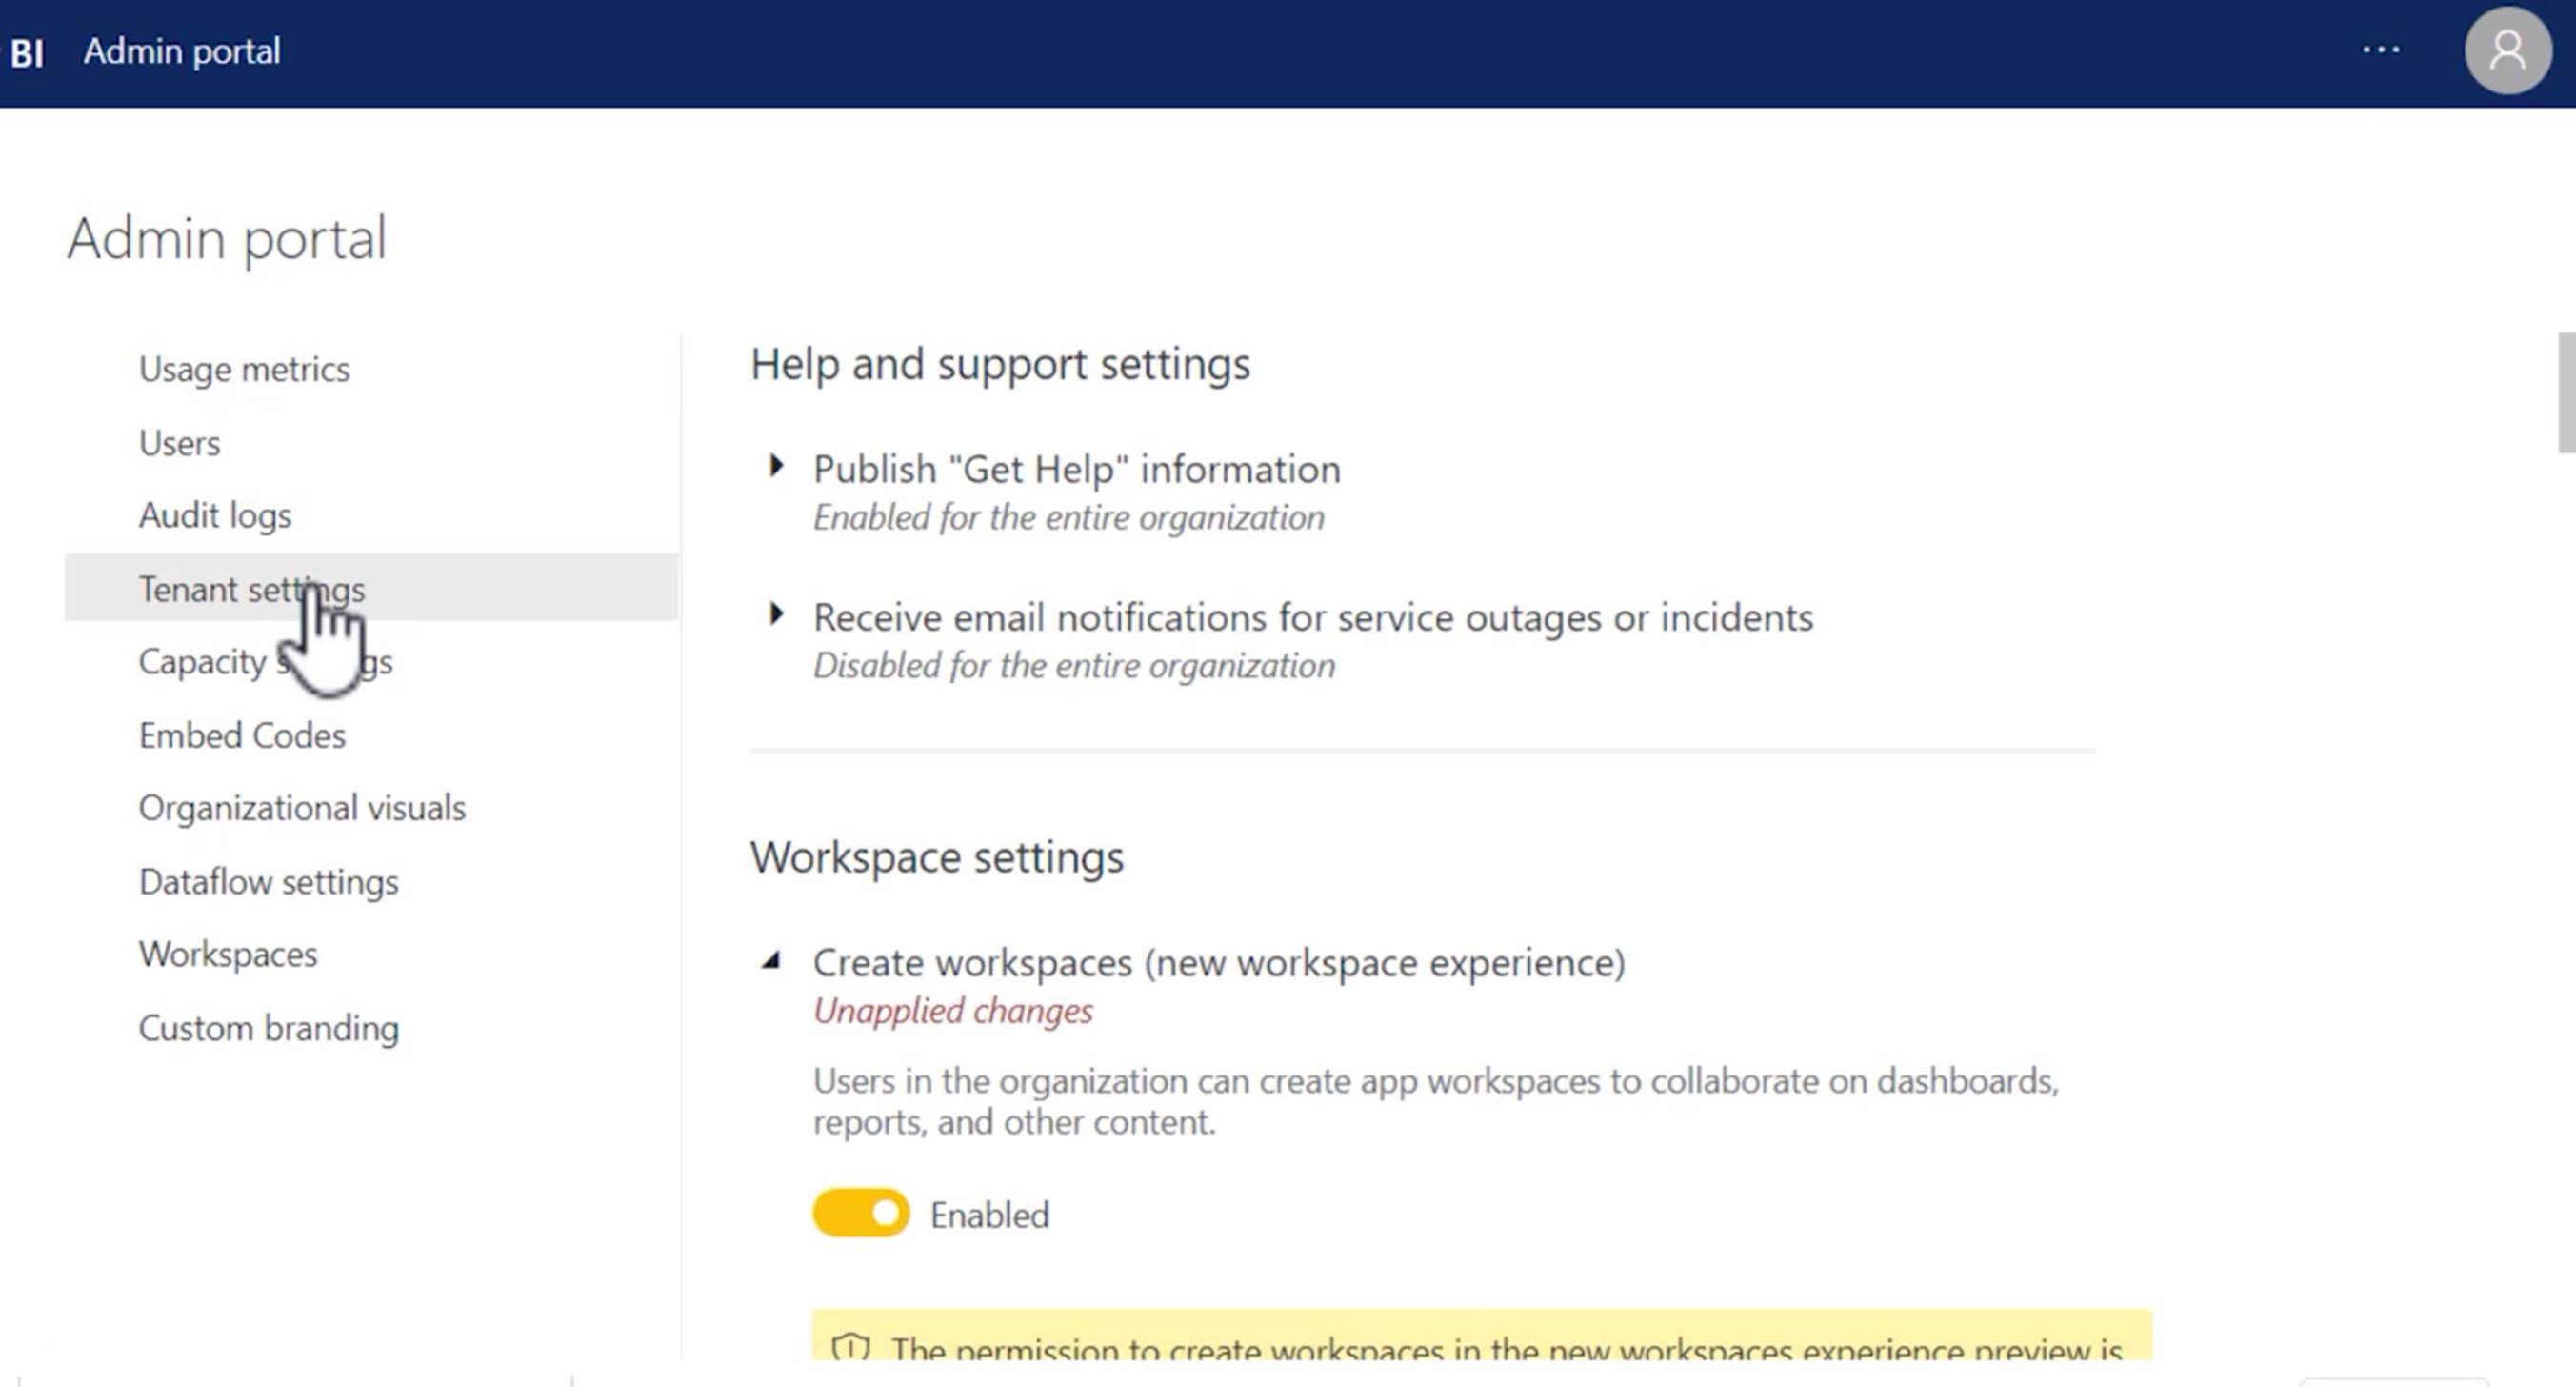
In the Admin Portal, click on “Tenant Settings”.
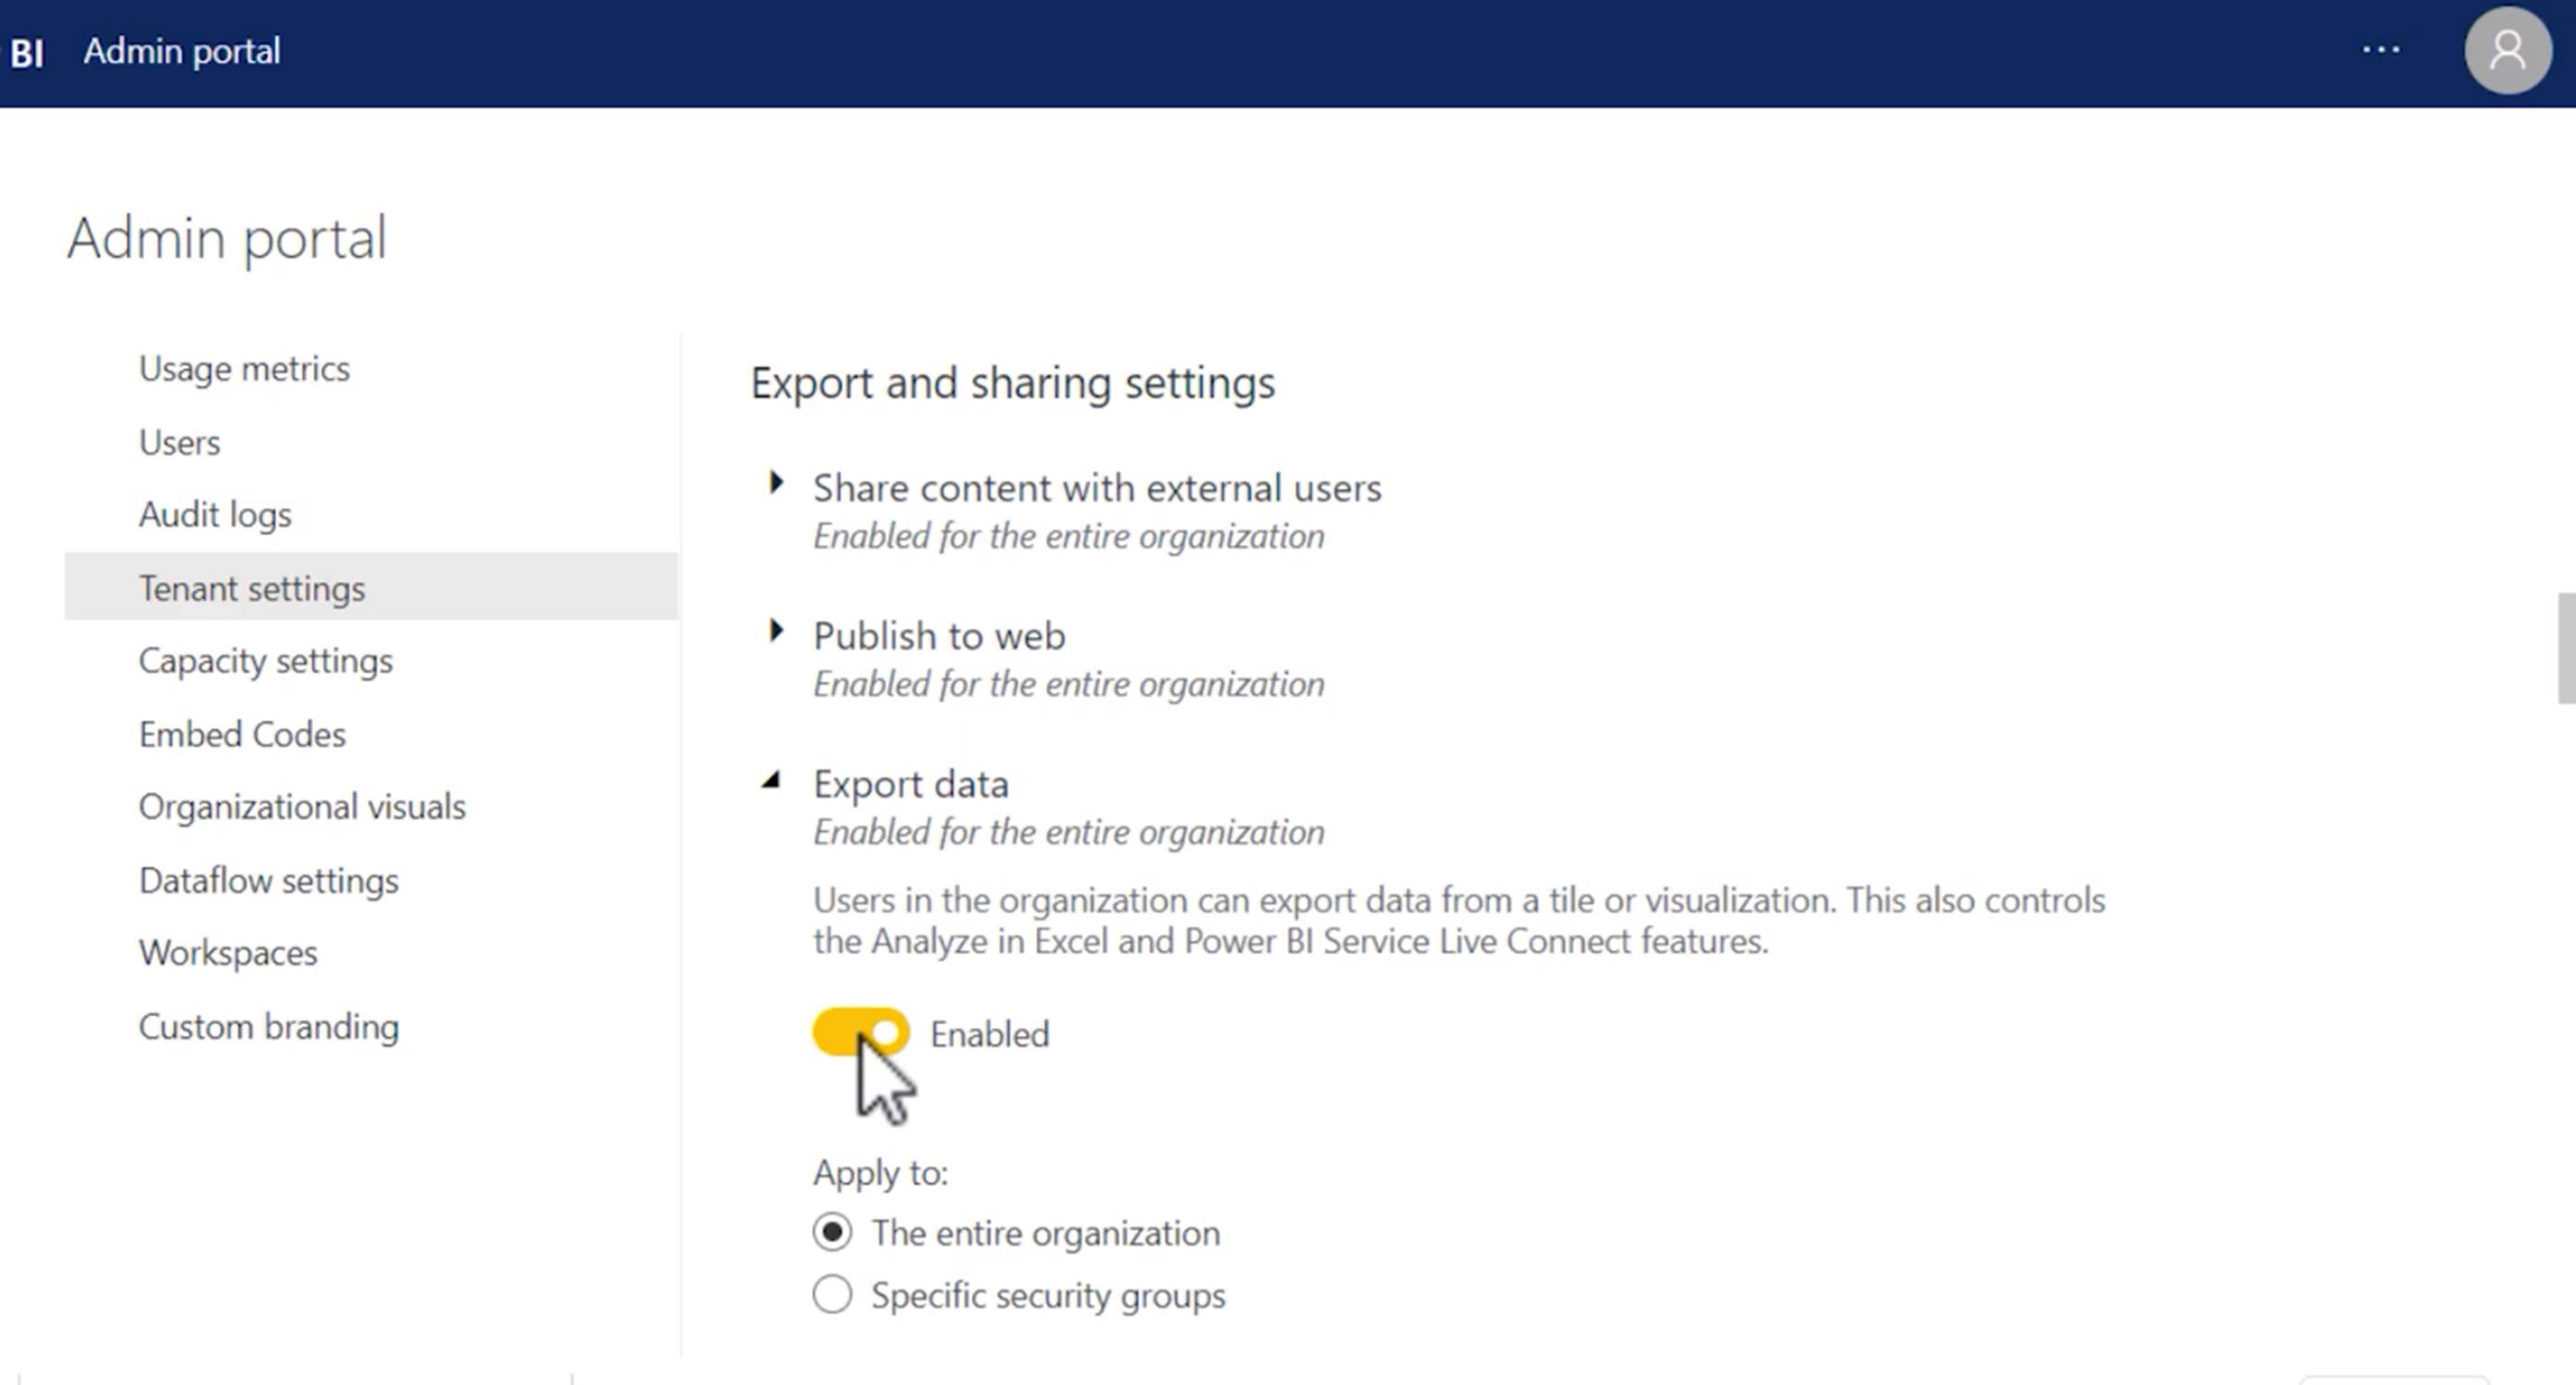
And scroll down to the “Export and Sharing” category and expand “Export Data”. (The setting can be enabled for the entire organization or only for specific groups.)
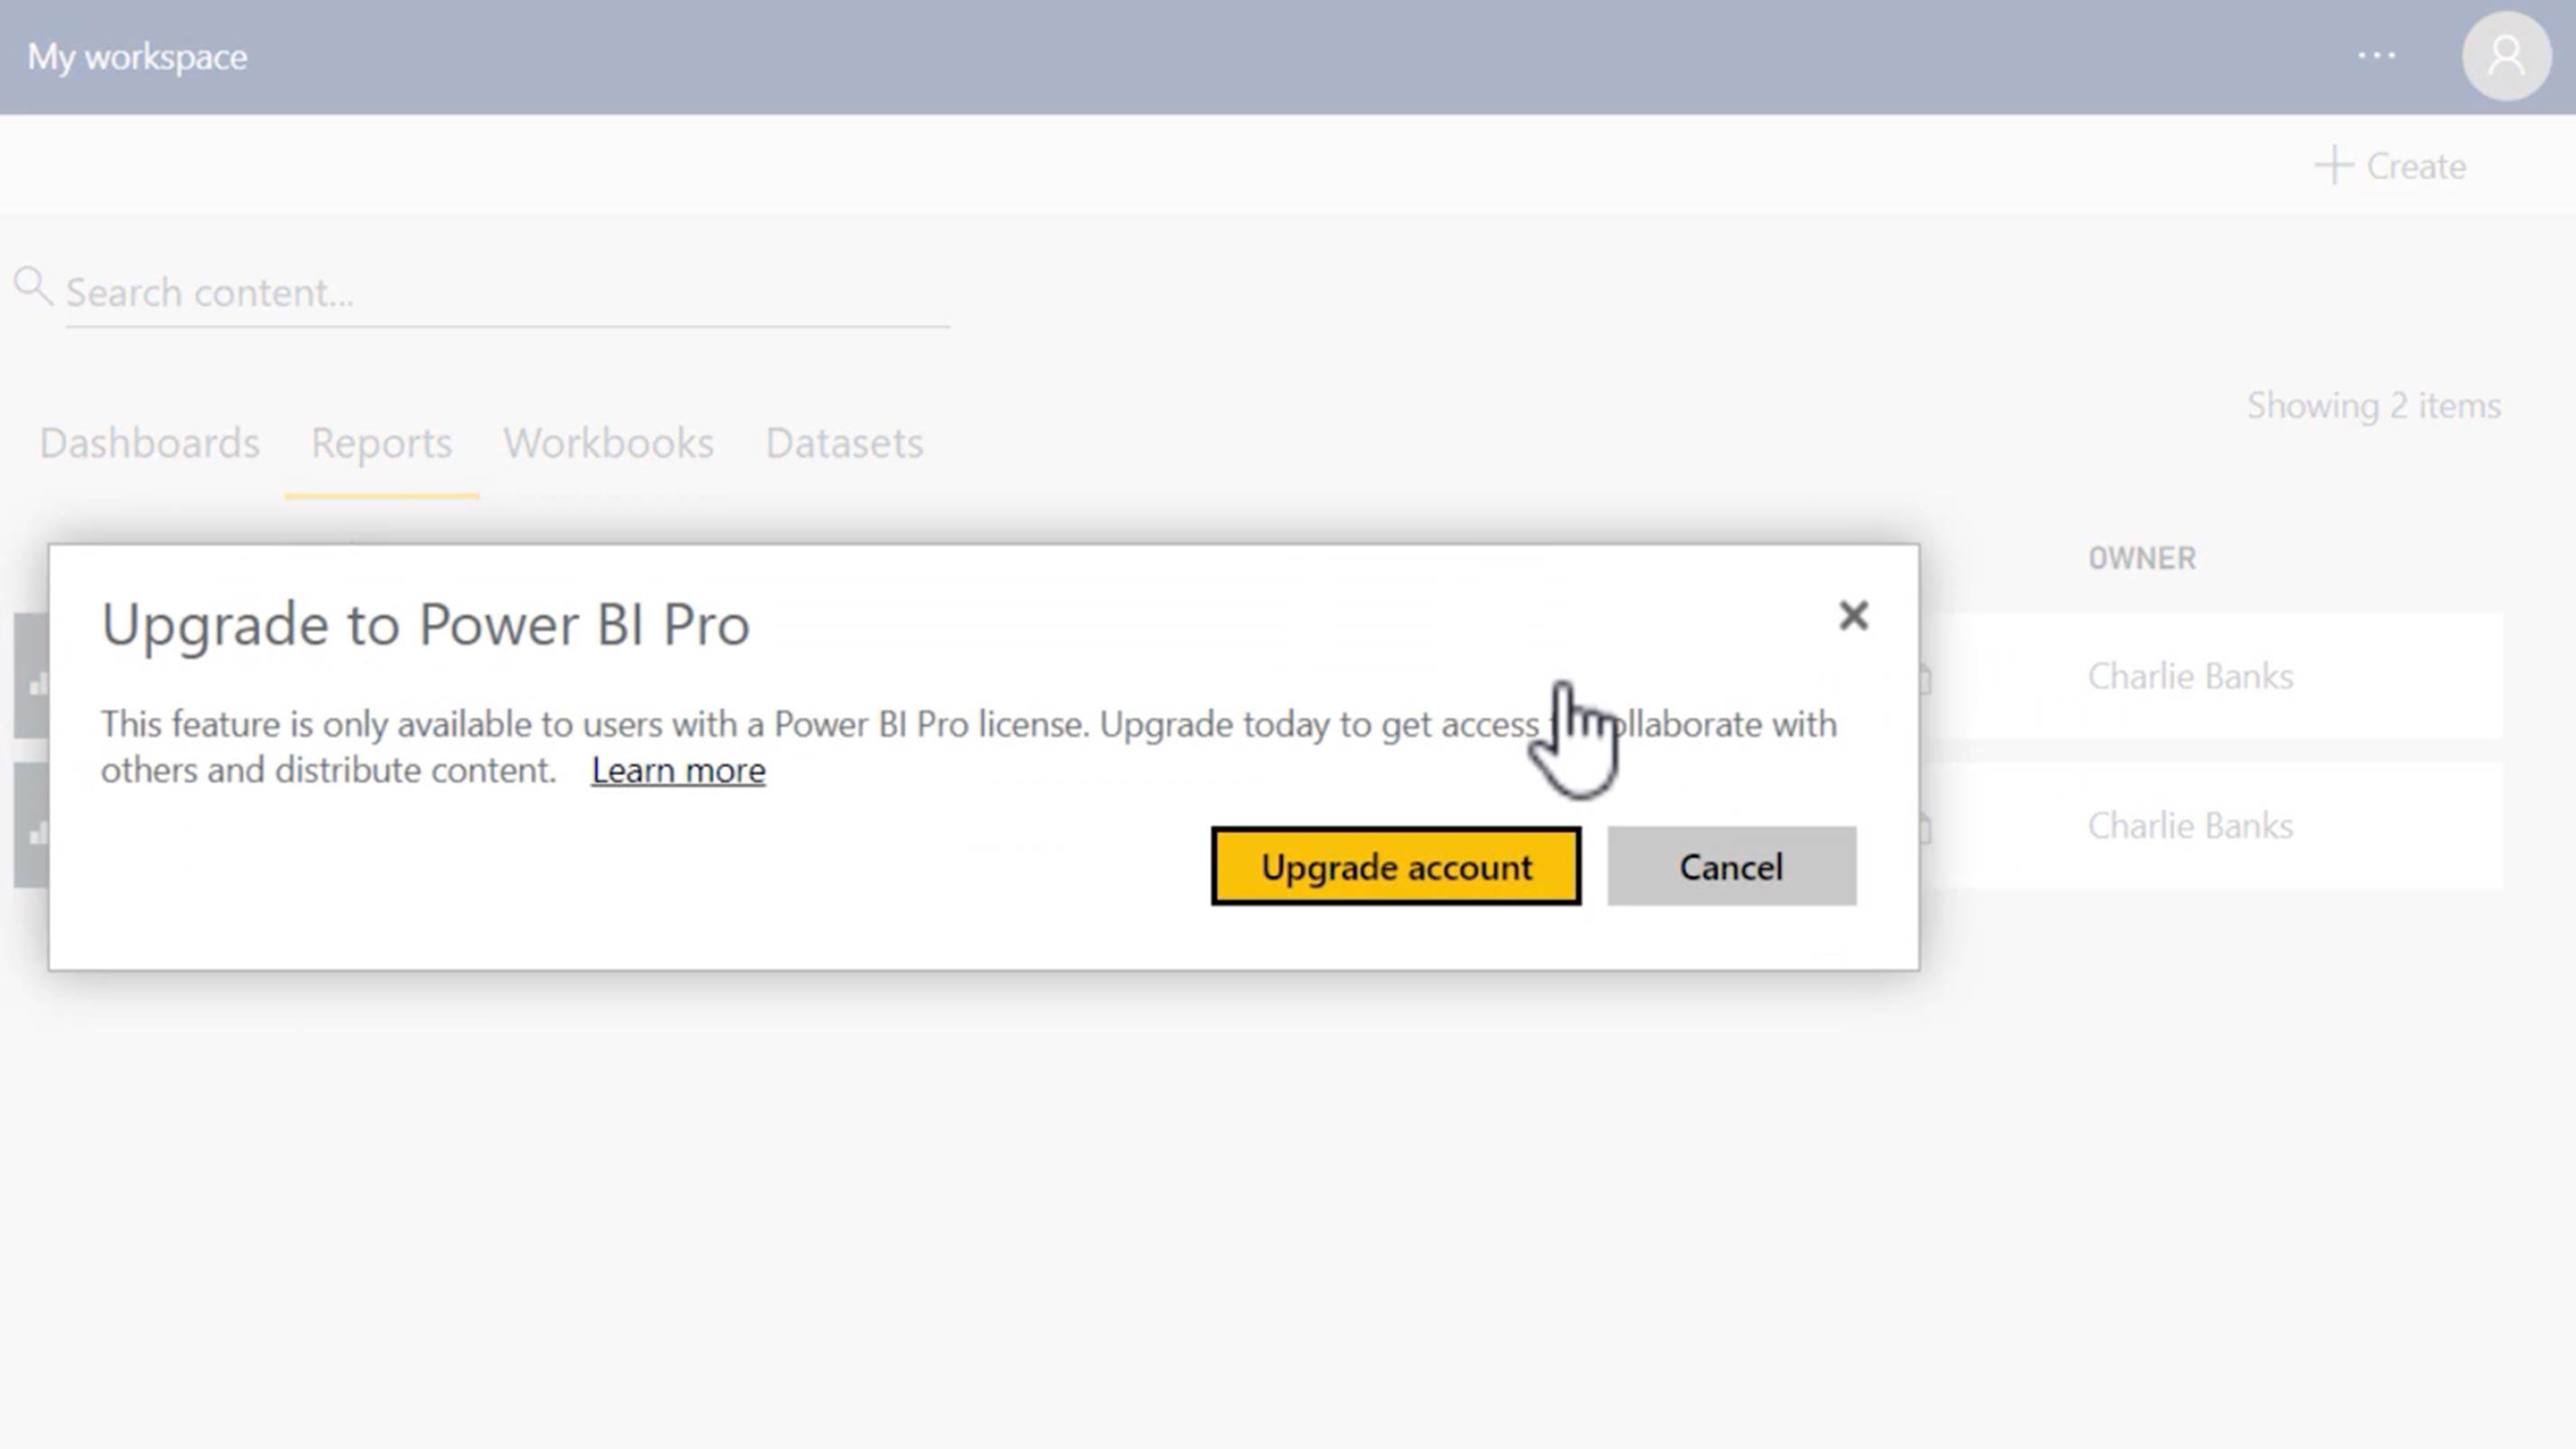
If a free user attempts to use this feature, they will be prompted with an invitation to upgrade to a Power BI Pro license.
To experiment with the Analyze in Excel feature, we will create an Excel report linked to the Power BI sales report shown in the following screenshot.
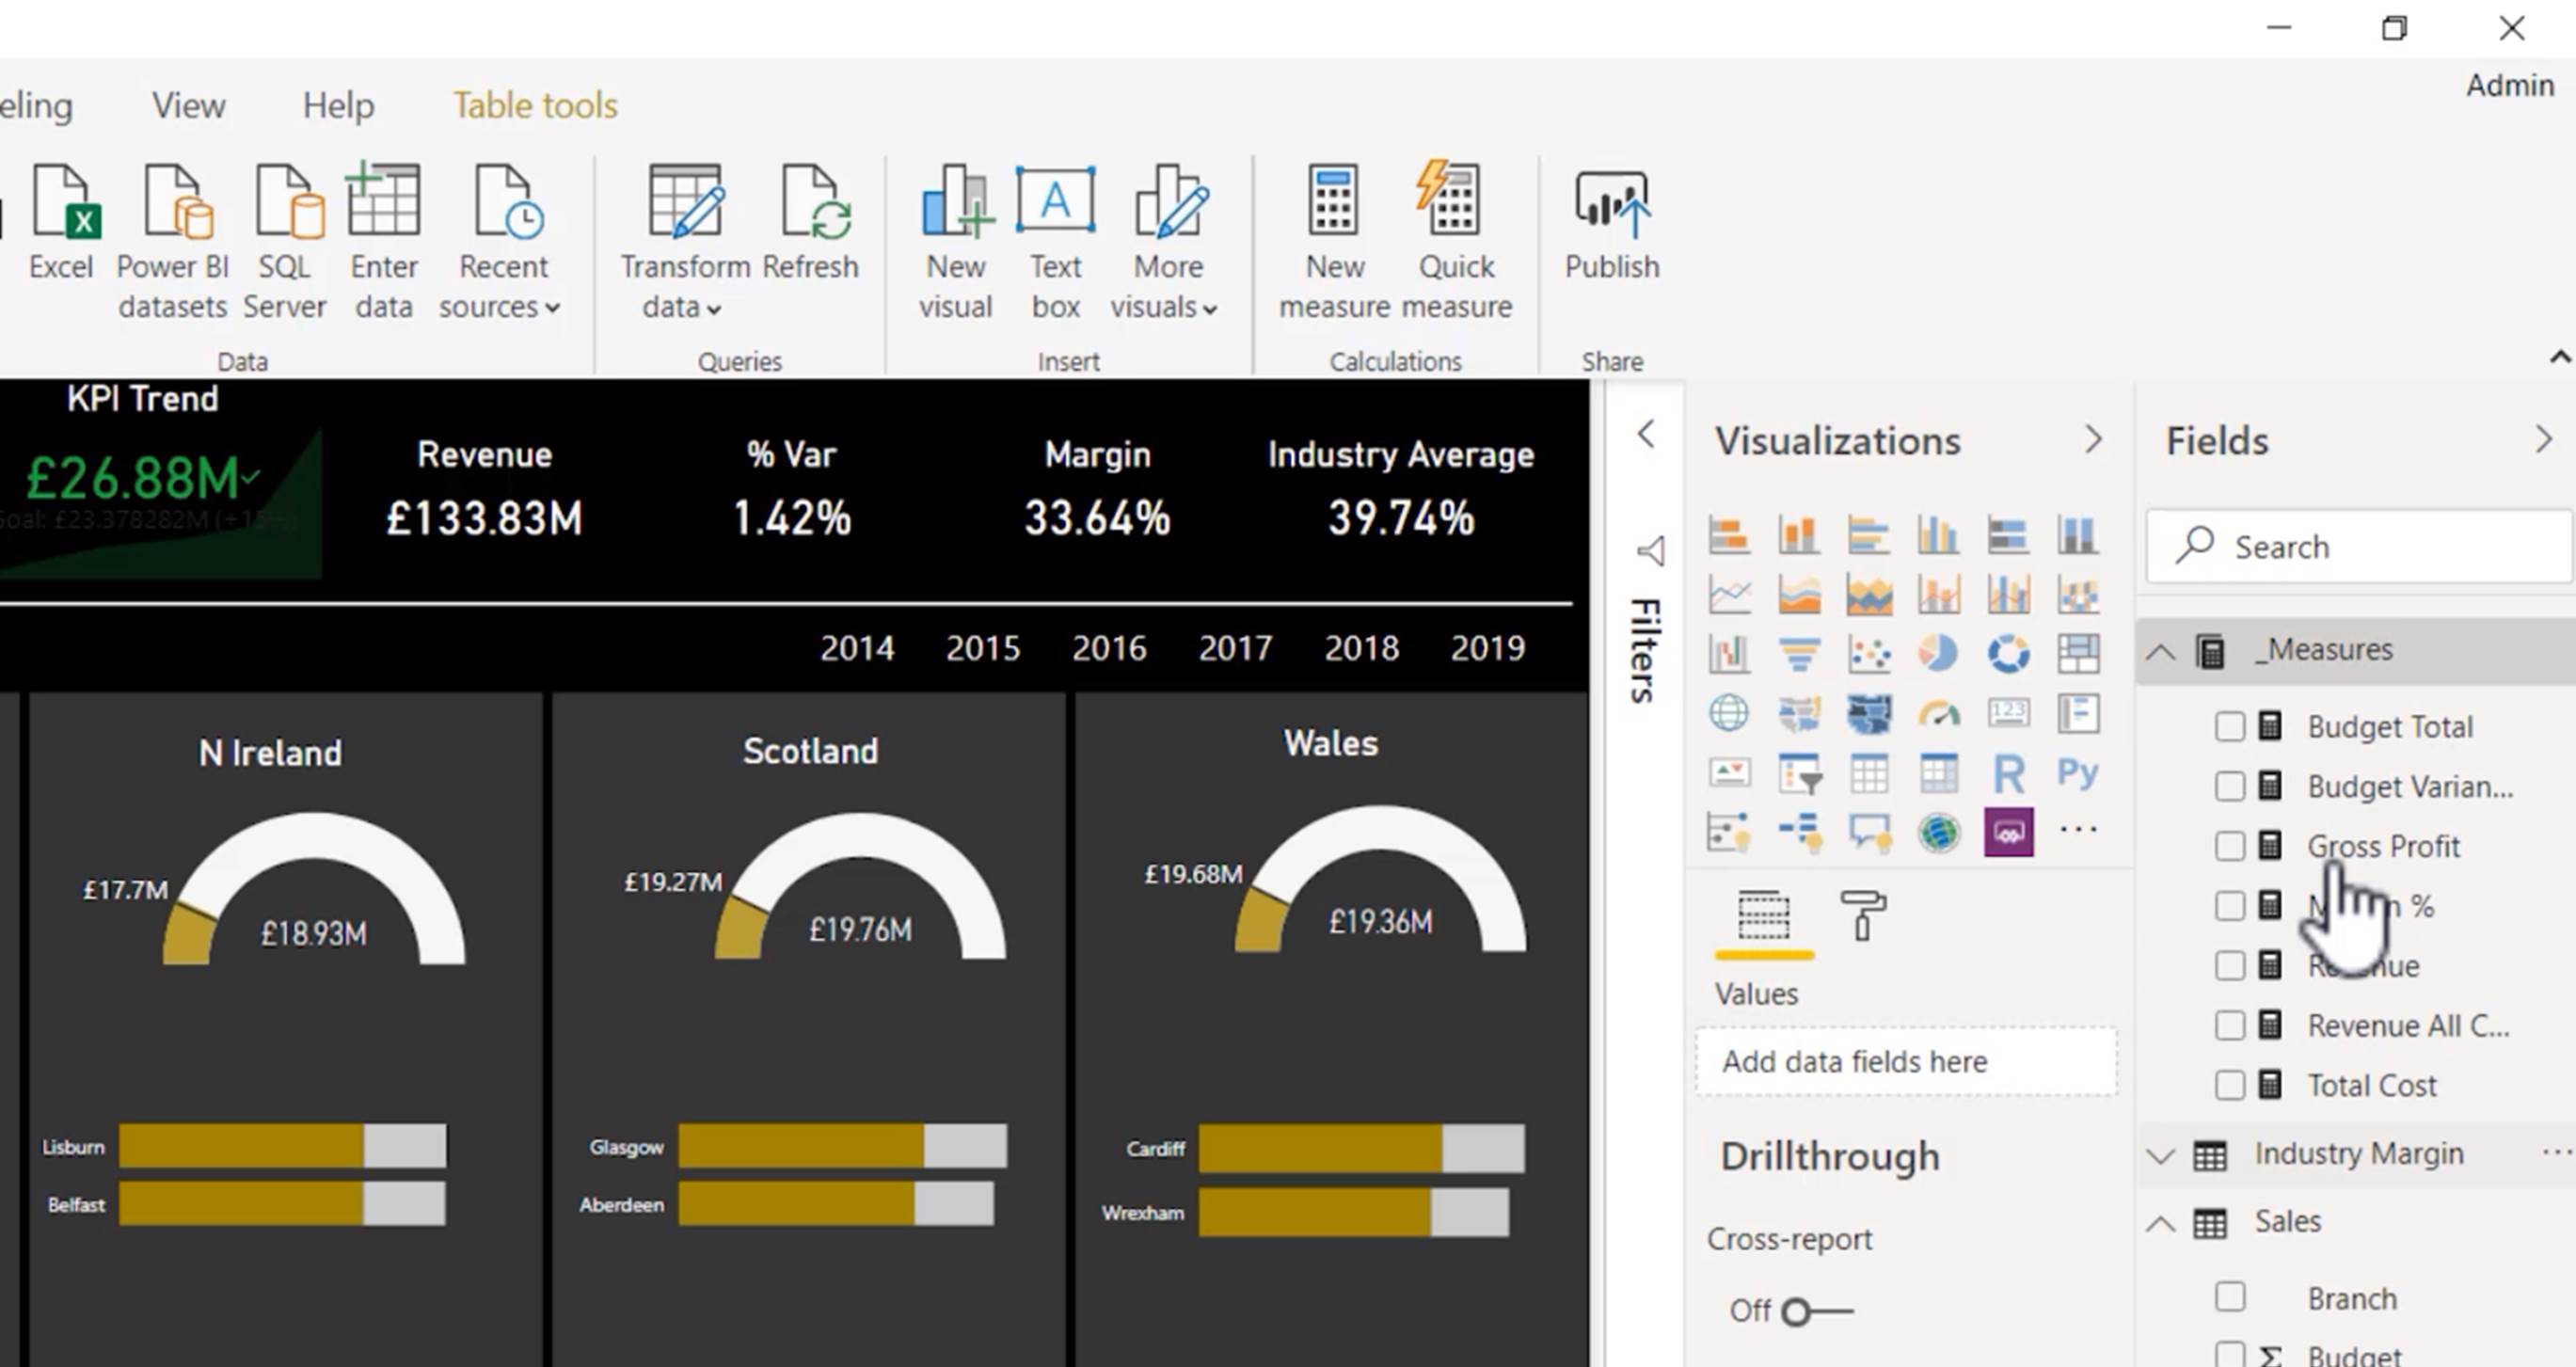
Notice that this report has measures. This is important, since when using the Analyze in Excel feature, only measures can be placed in the values area of a pivot table. (Table fields are not allowed.)
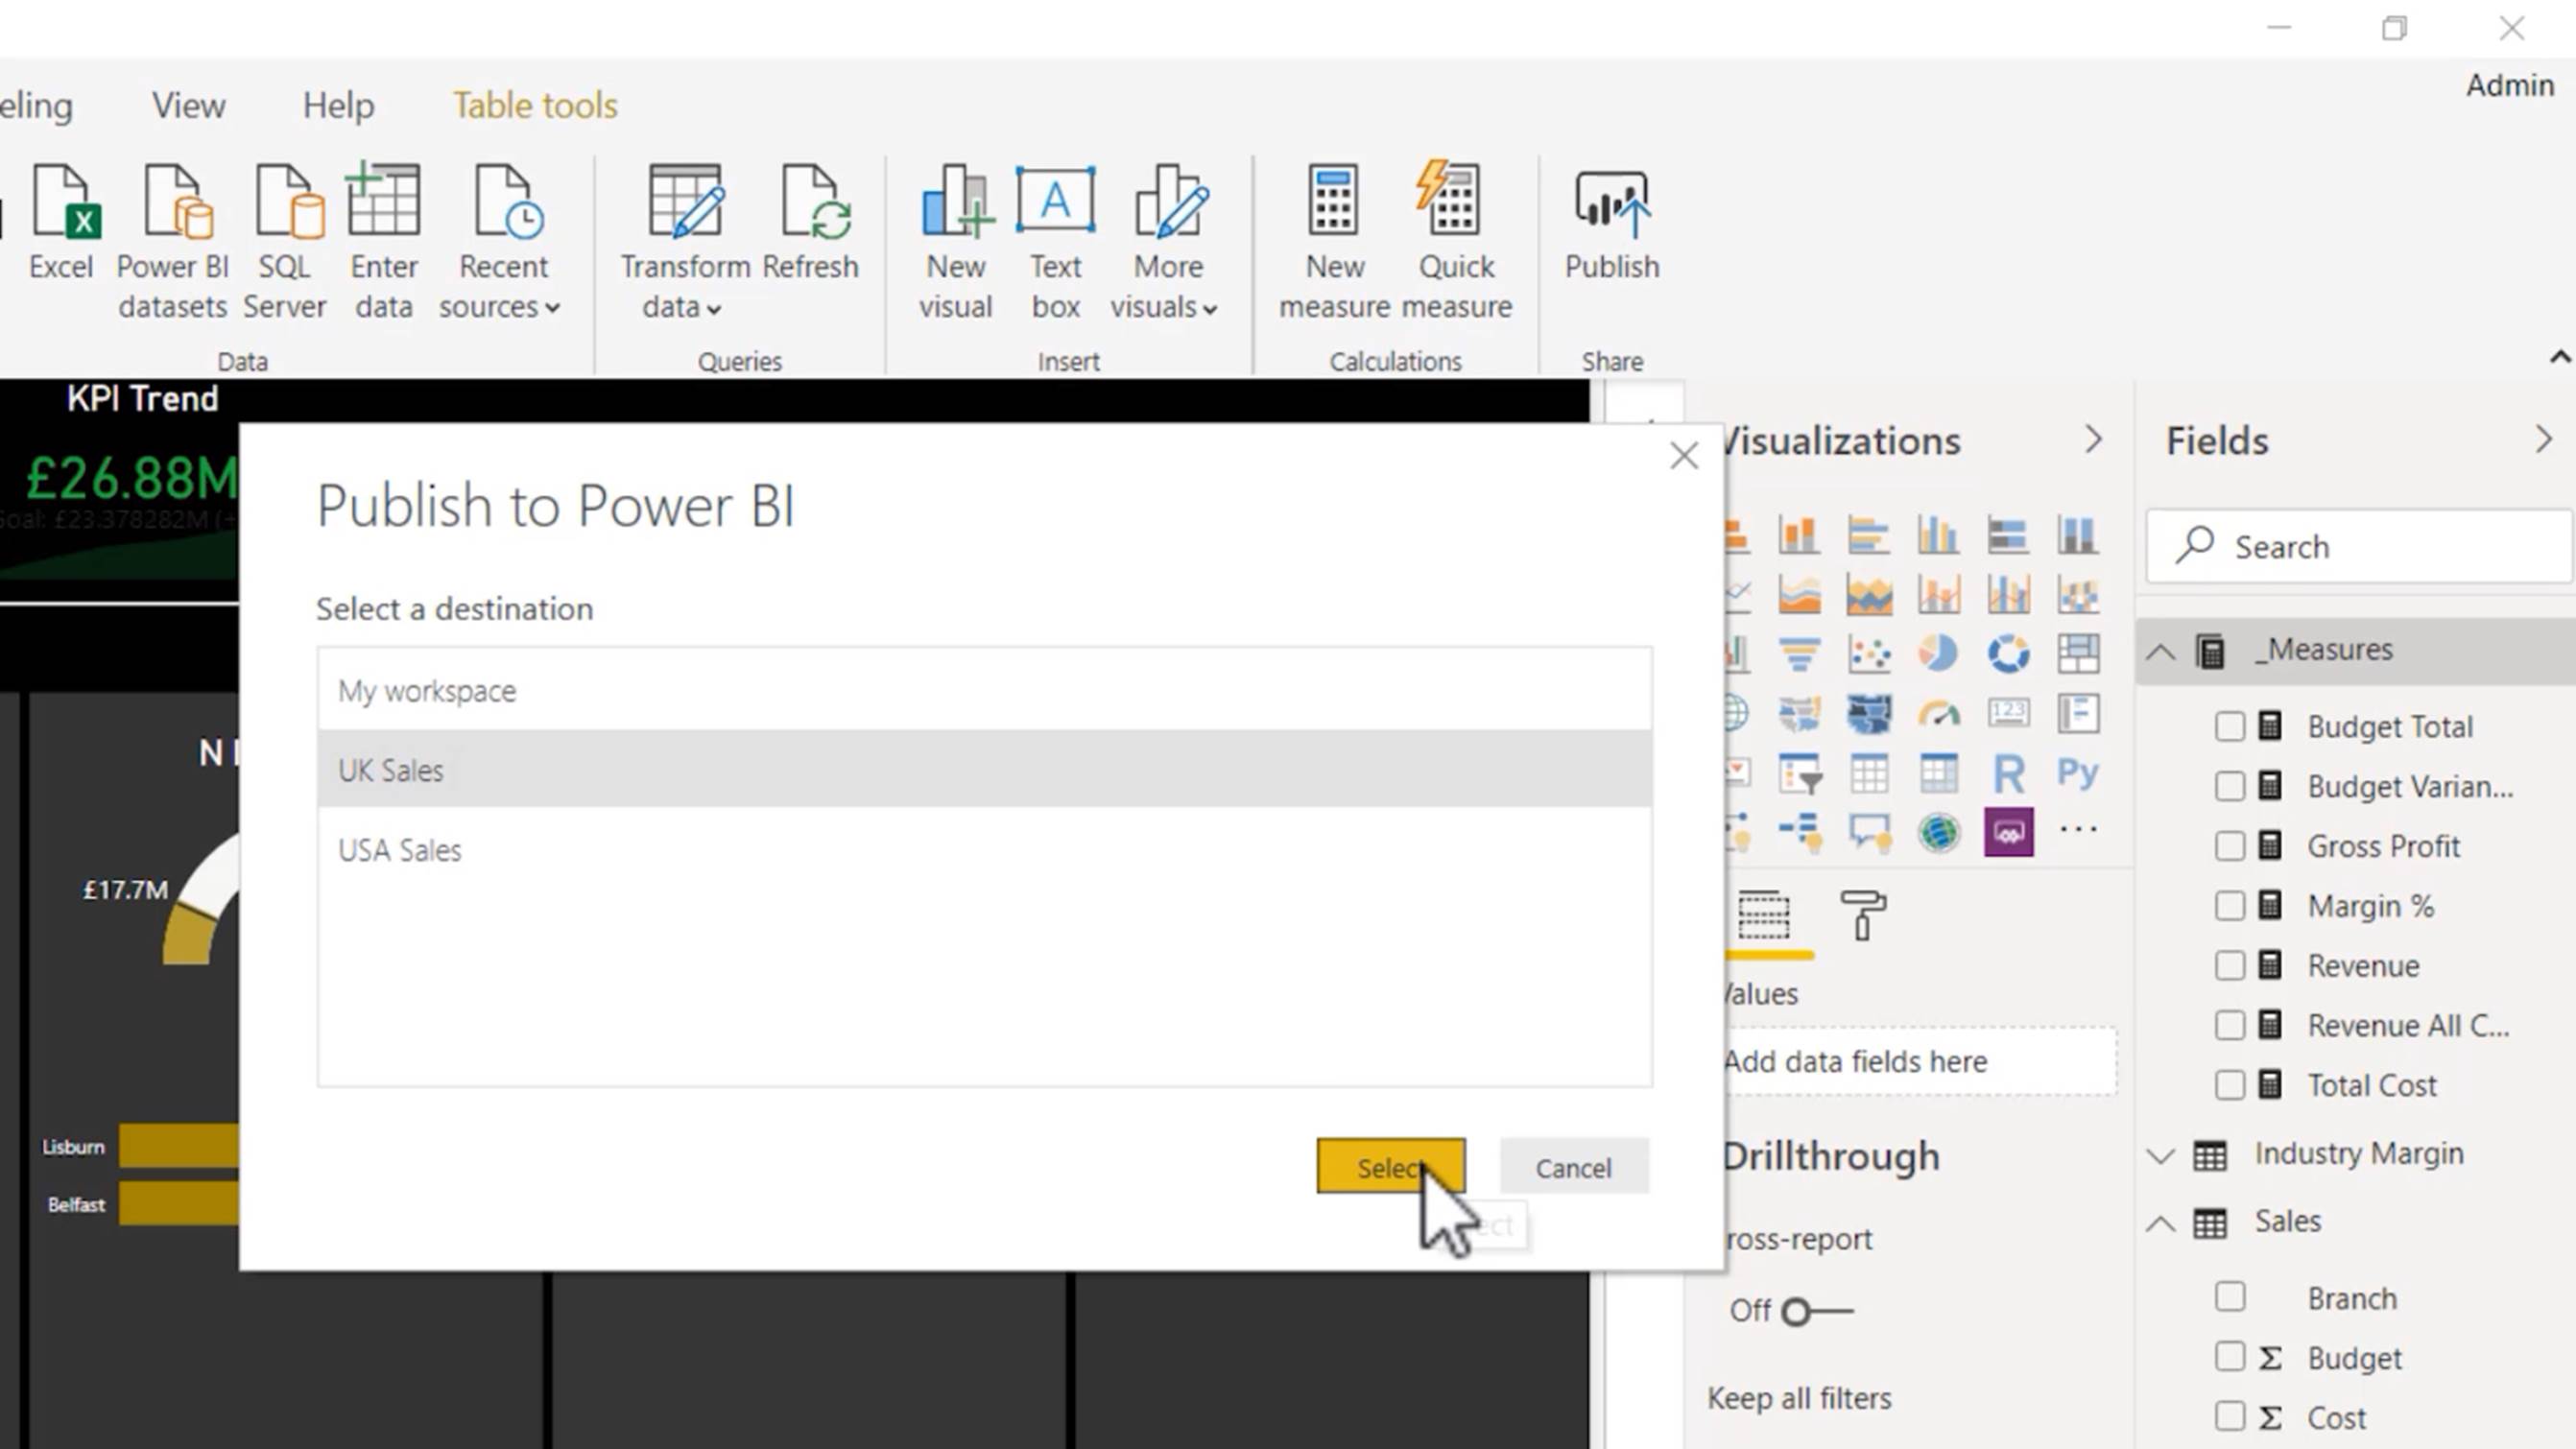
Since this is a Power BI service feature, we must first publish the report.
Then, in the Power BI service, anyone who has access to the Sales Report can click the “Analyze in Excel” button next to the name of the report.
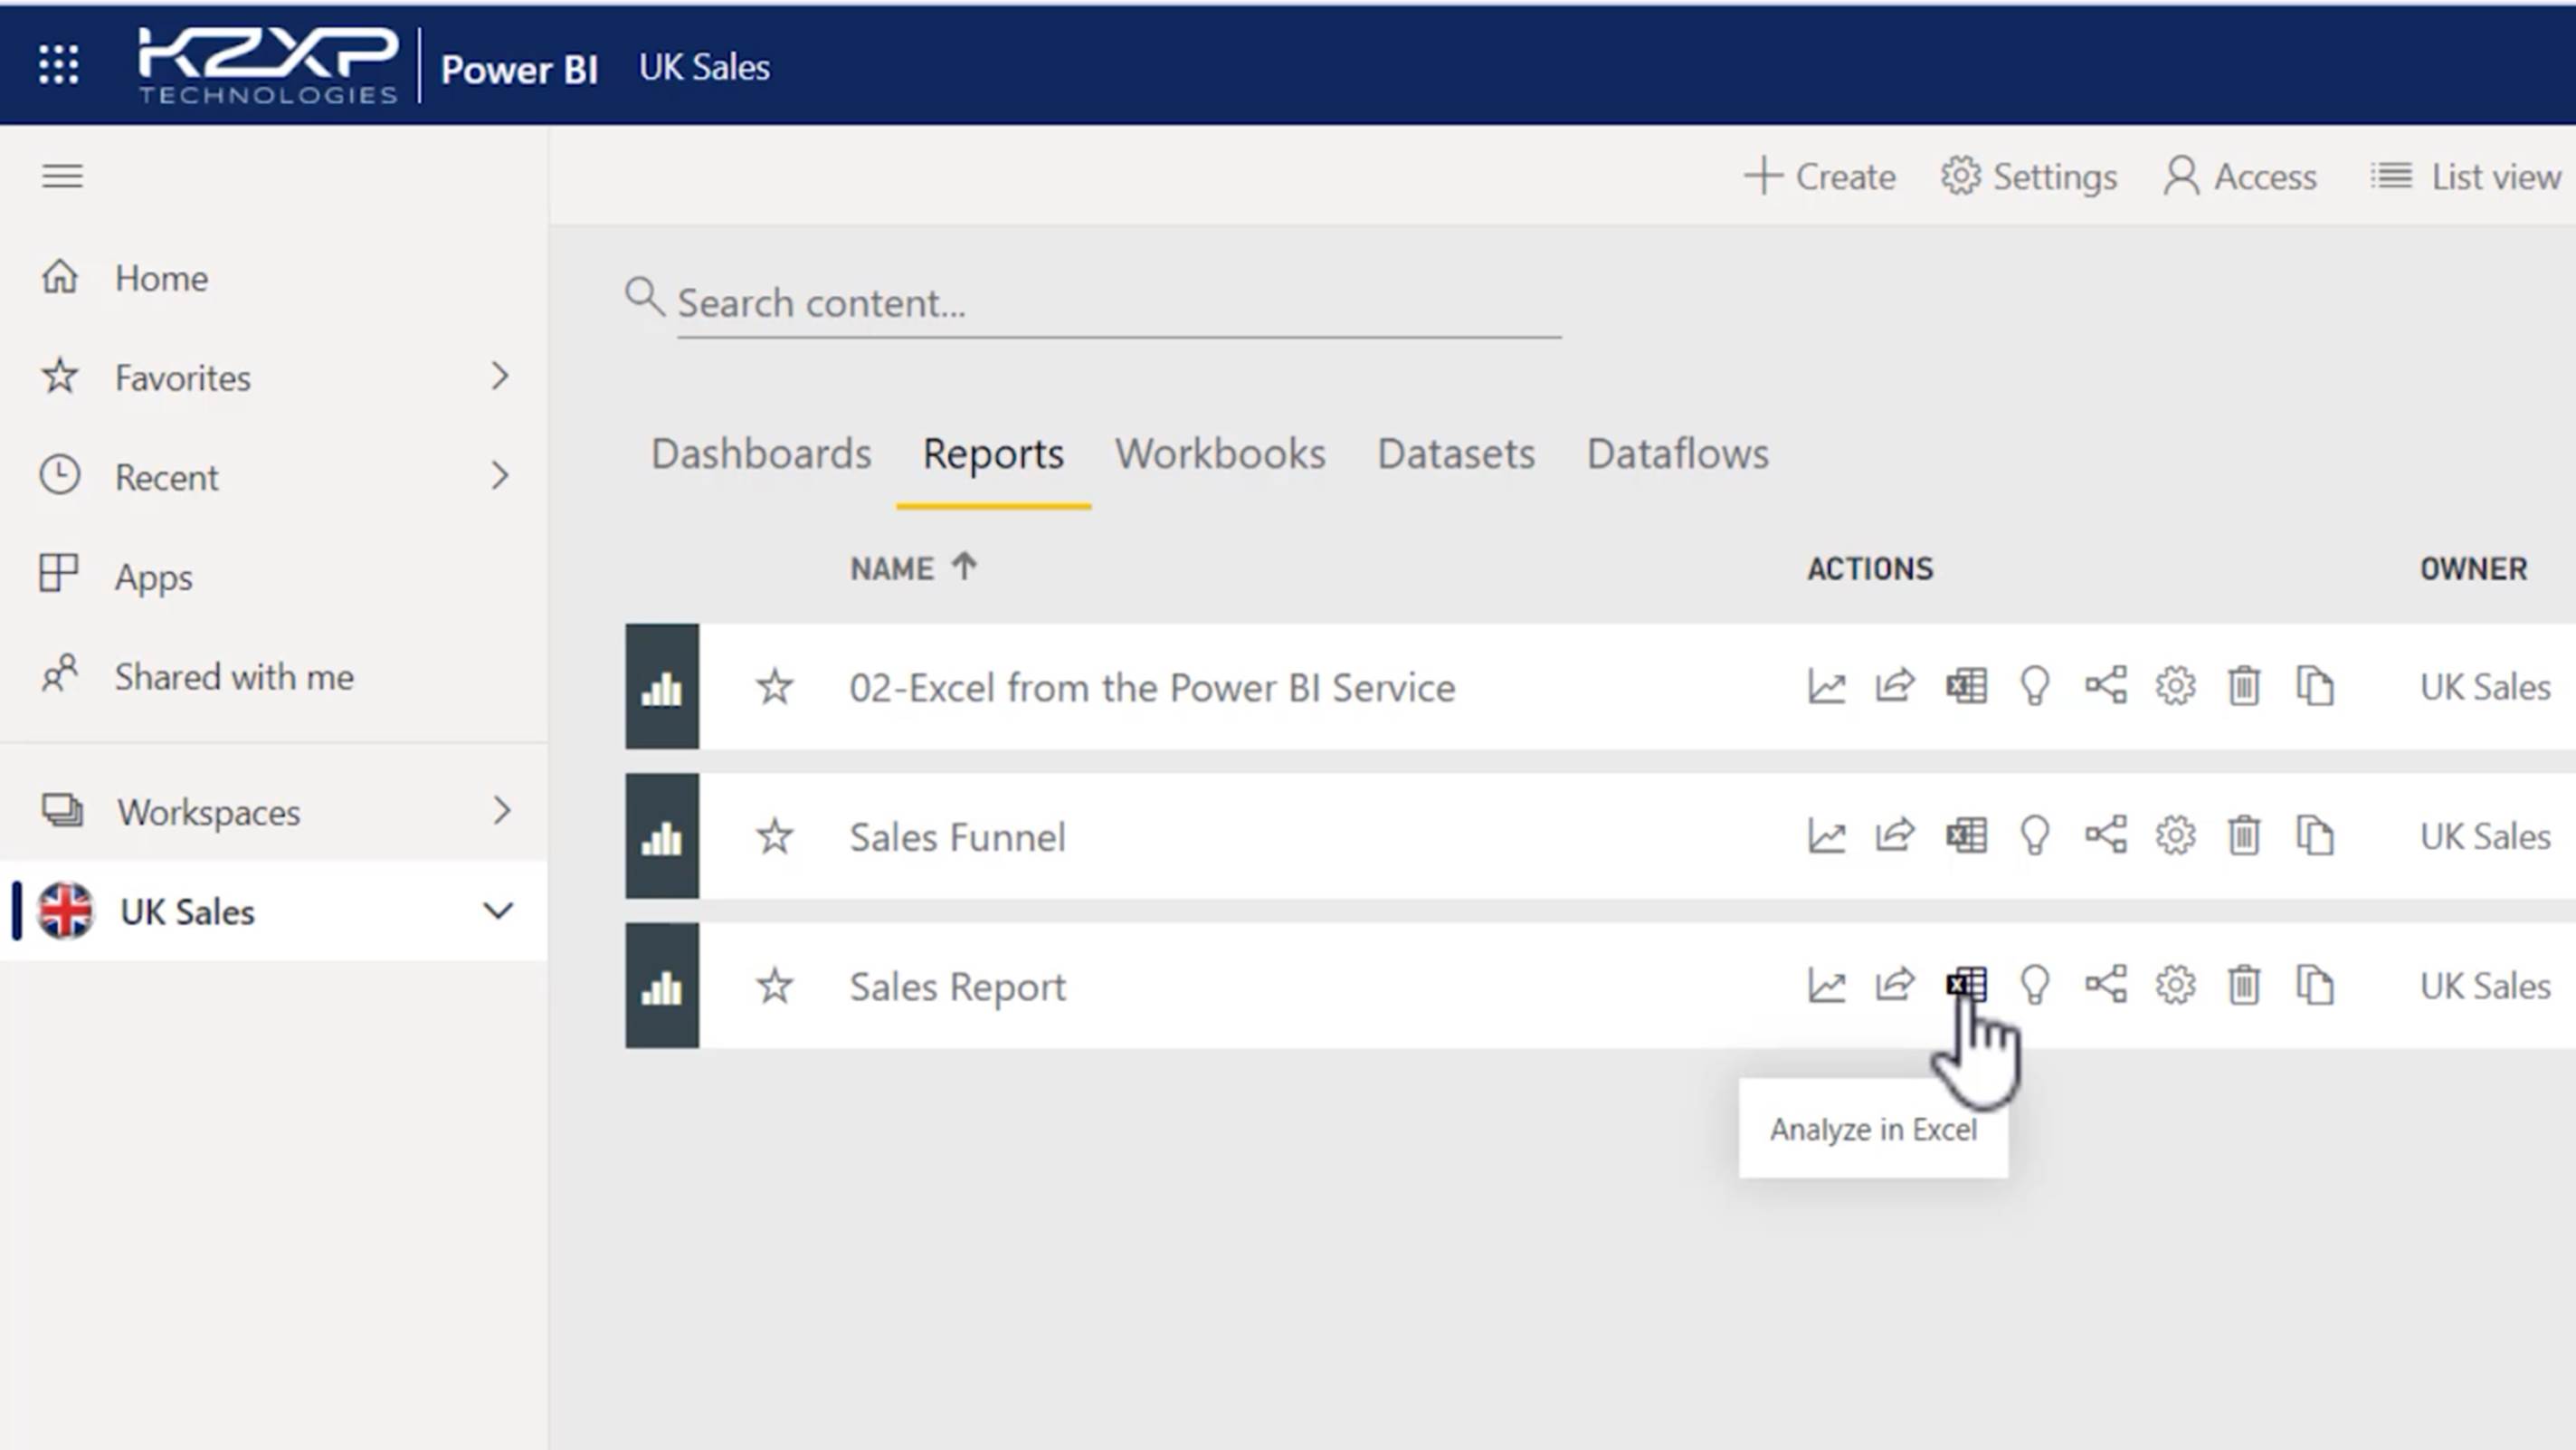
Alternatively, anyone with access to the underlying dataset, can choose “Analyze in Excel” from the ellipsis menu next to the name of the dataset.
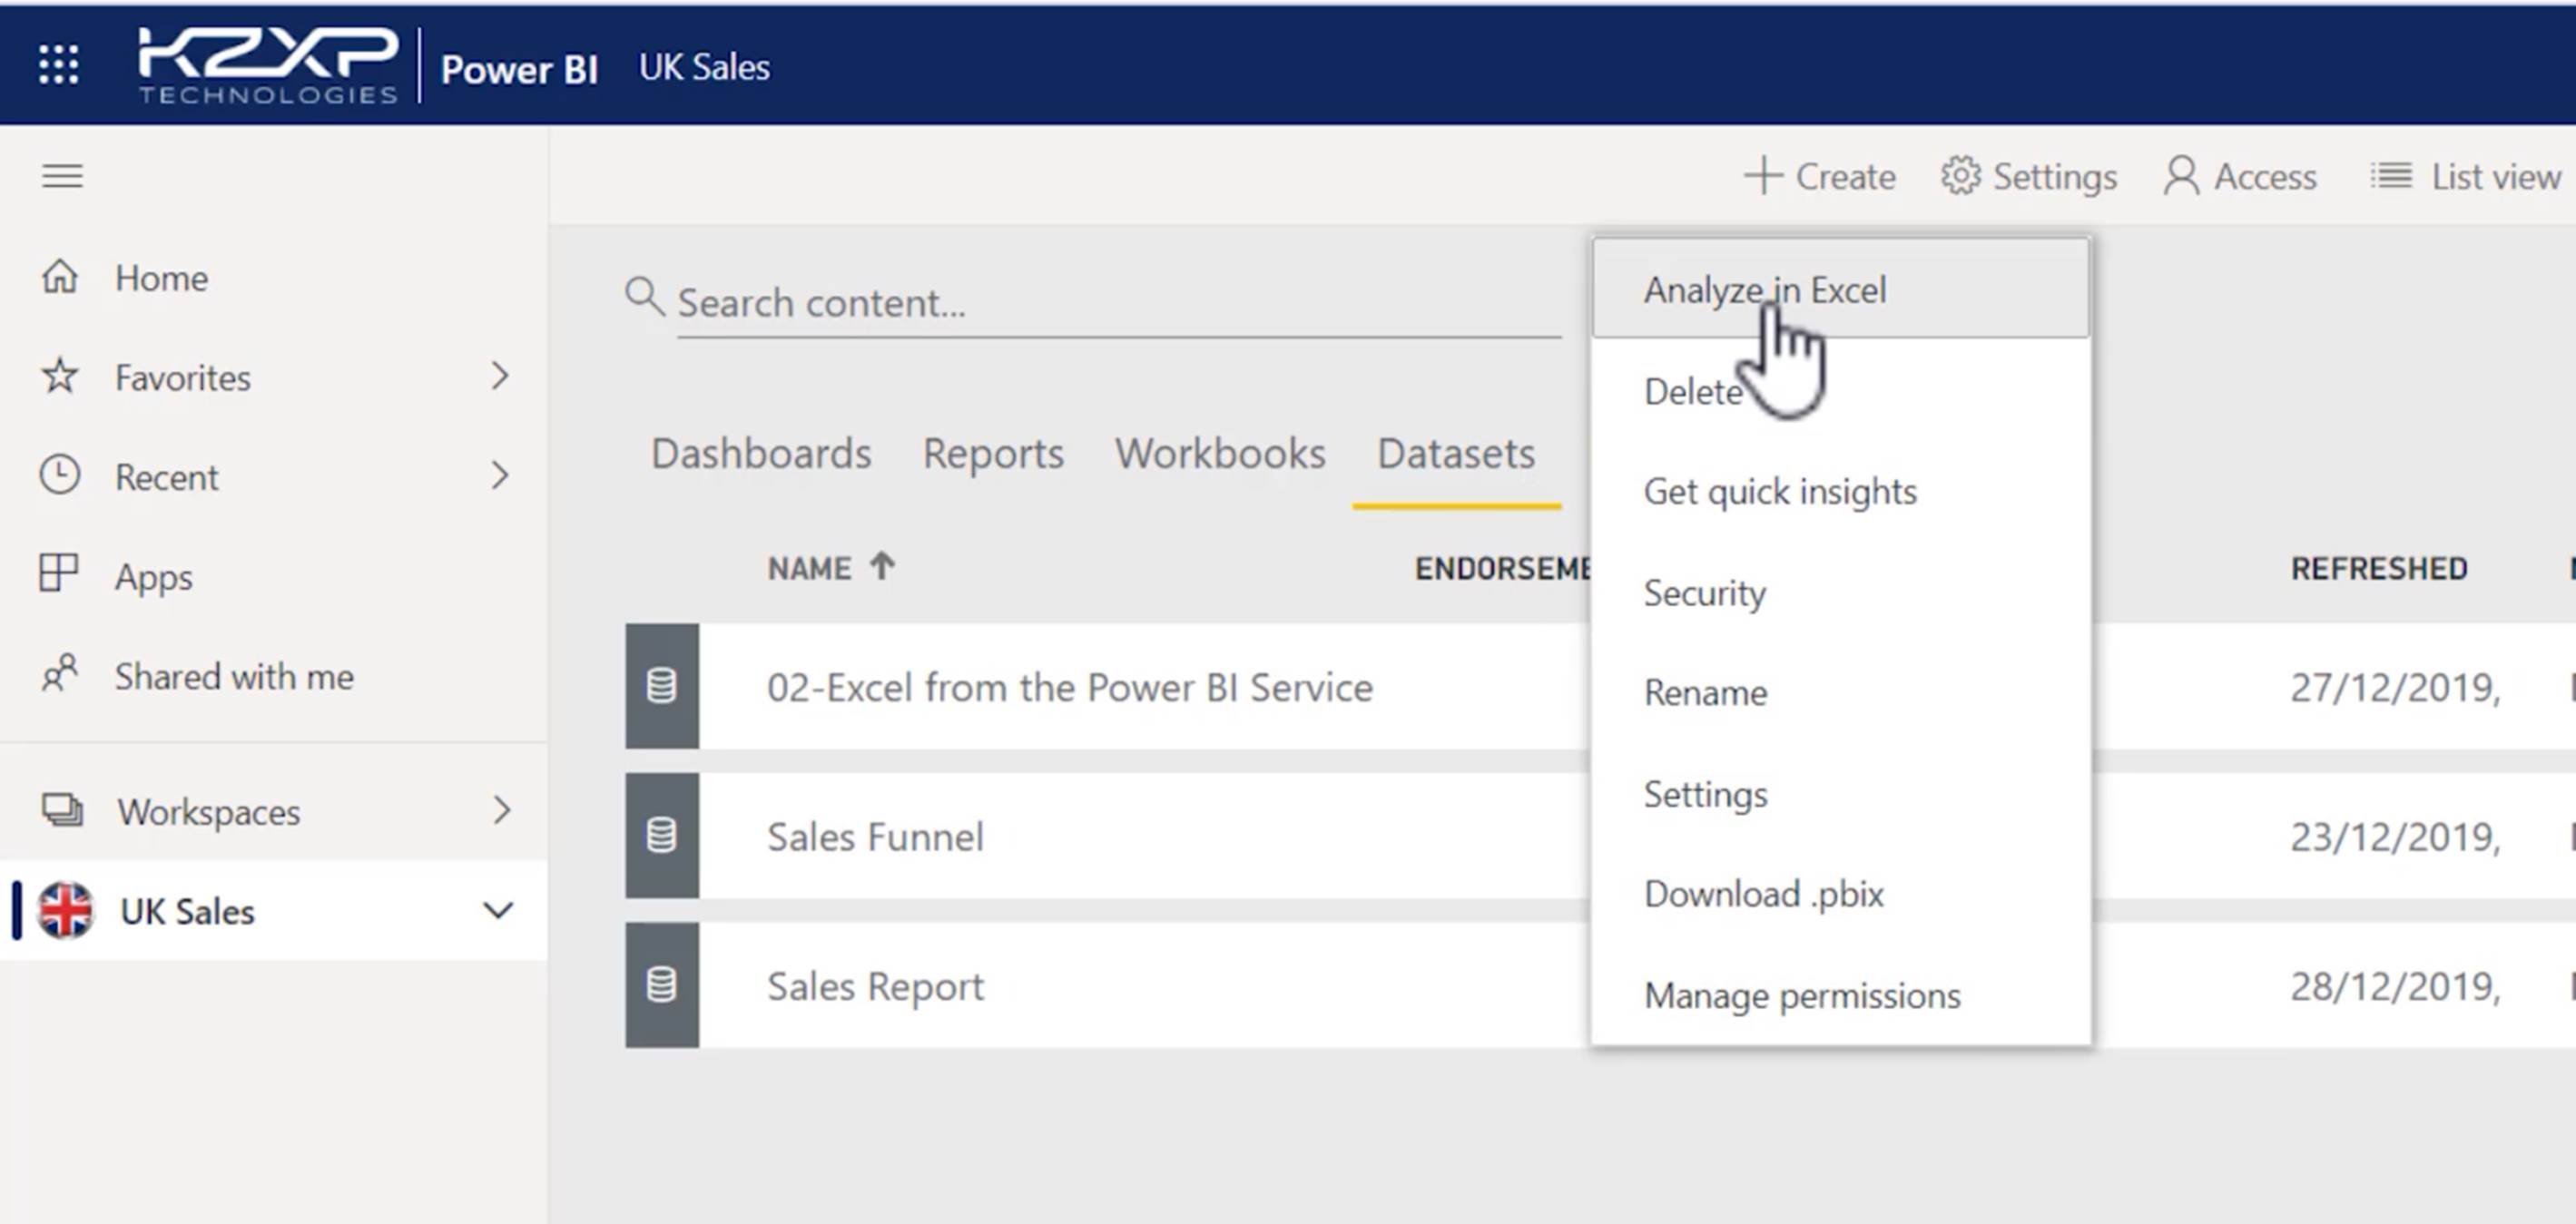
When using this feature for the first time on any given Windows machine, a warning message will be displayed, informing you that you need to install some Excel updates. Simply click “Download” then download and install the required software.
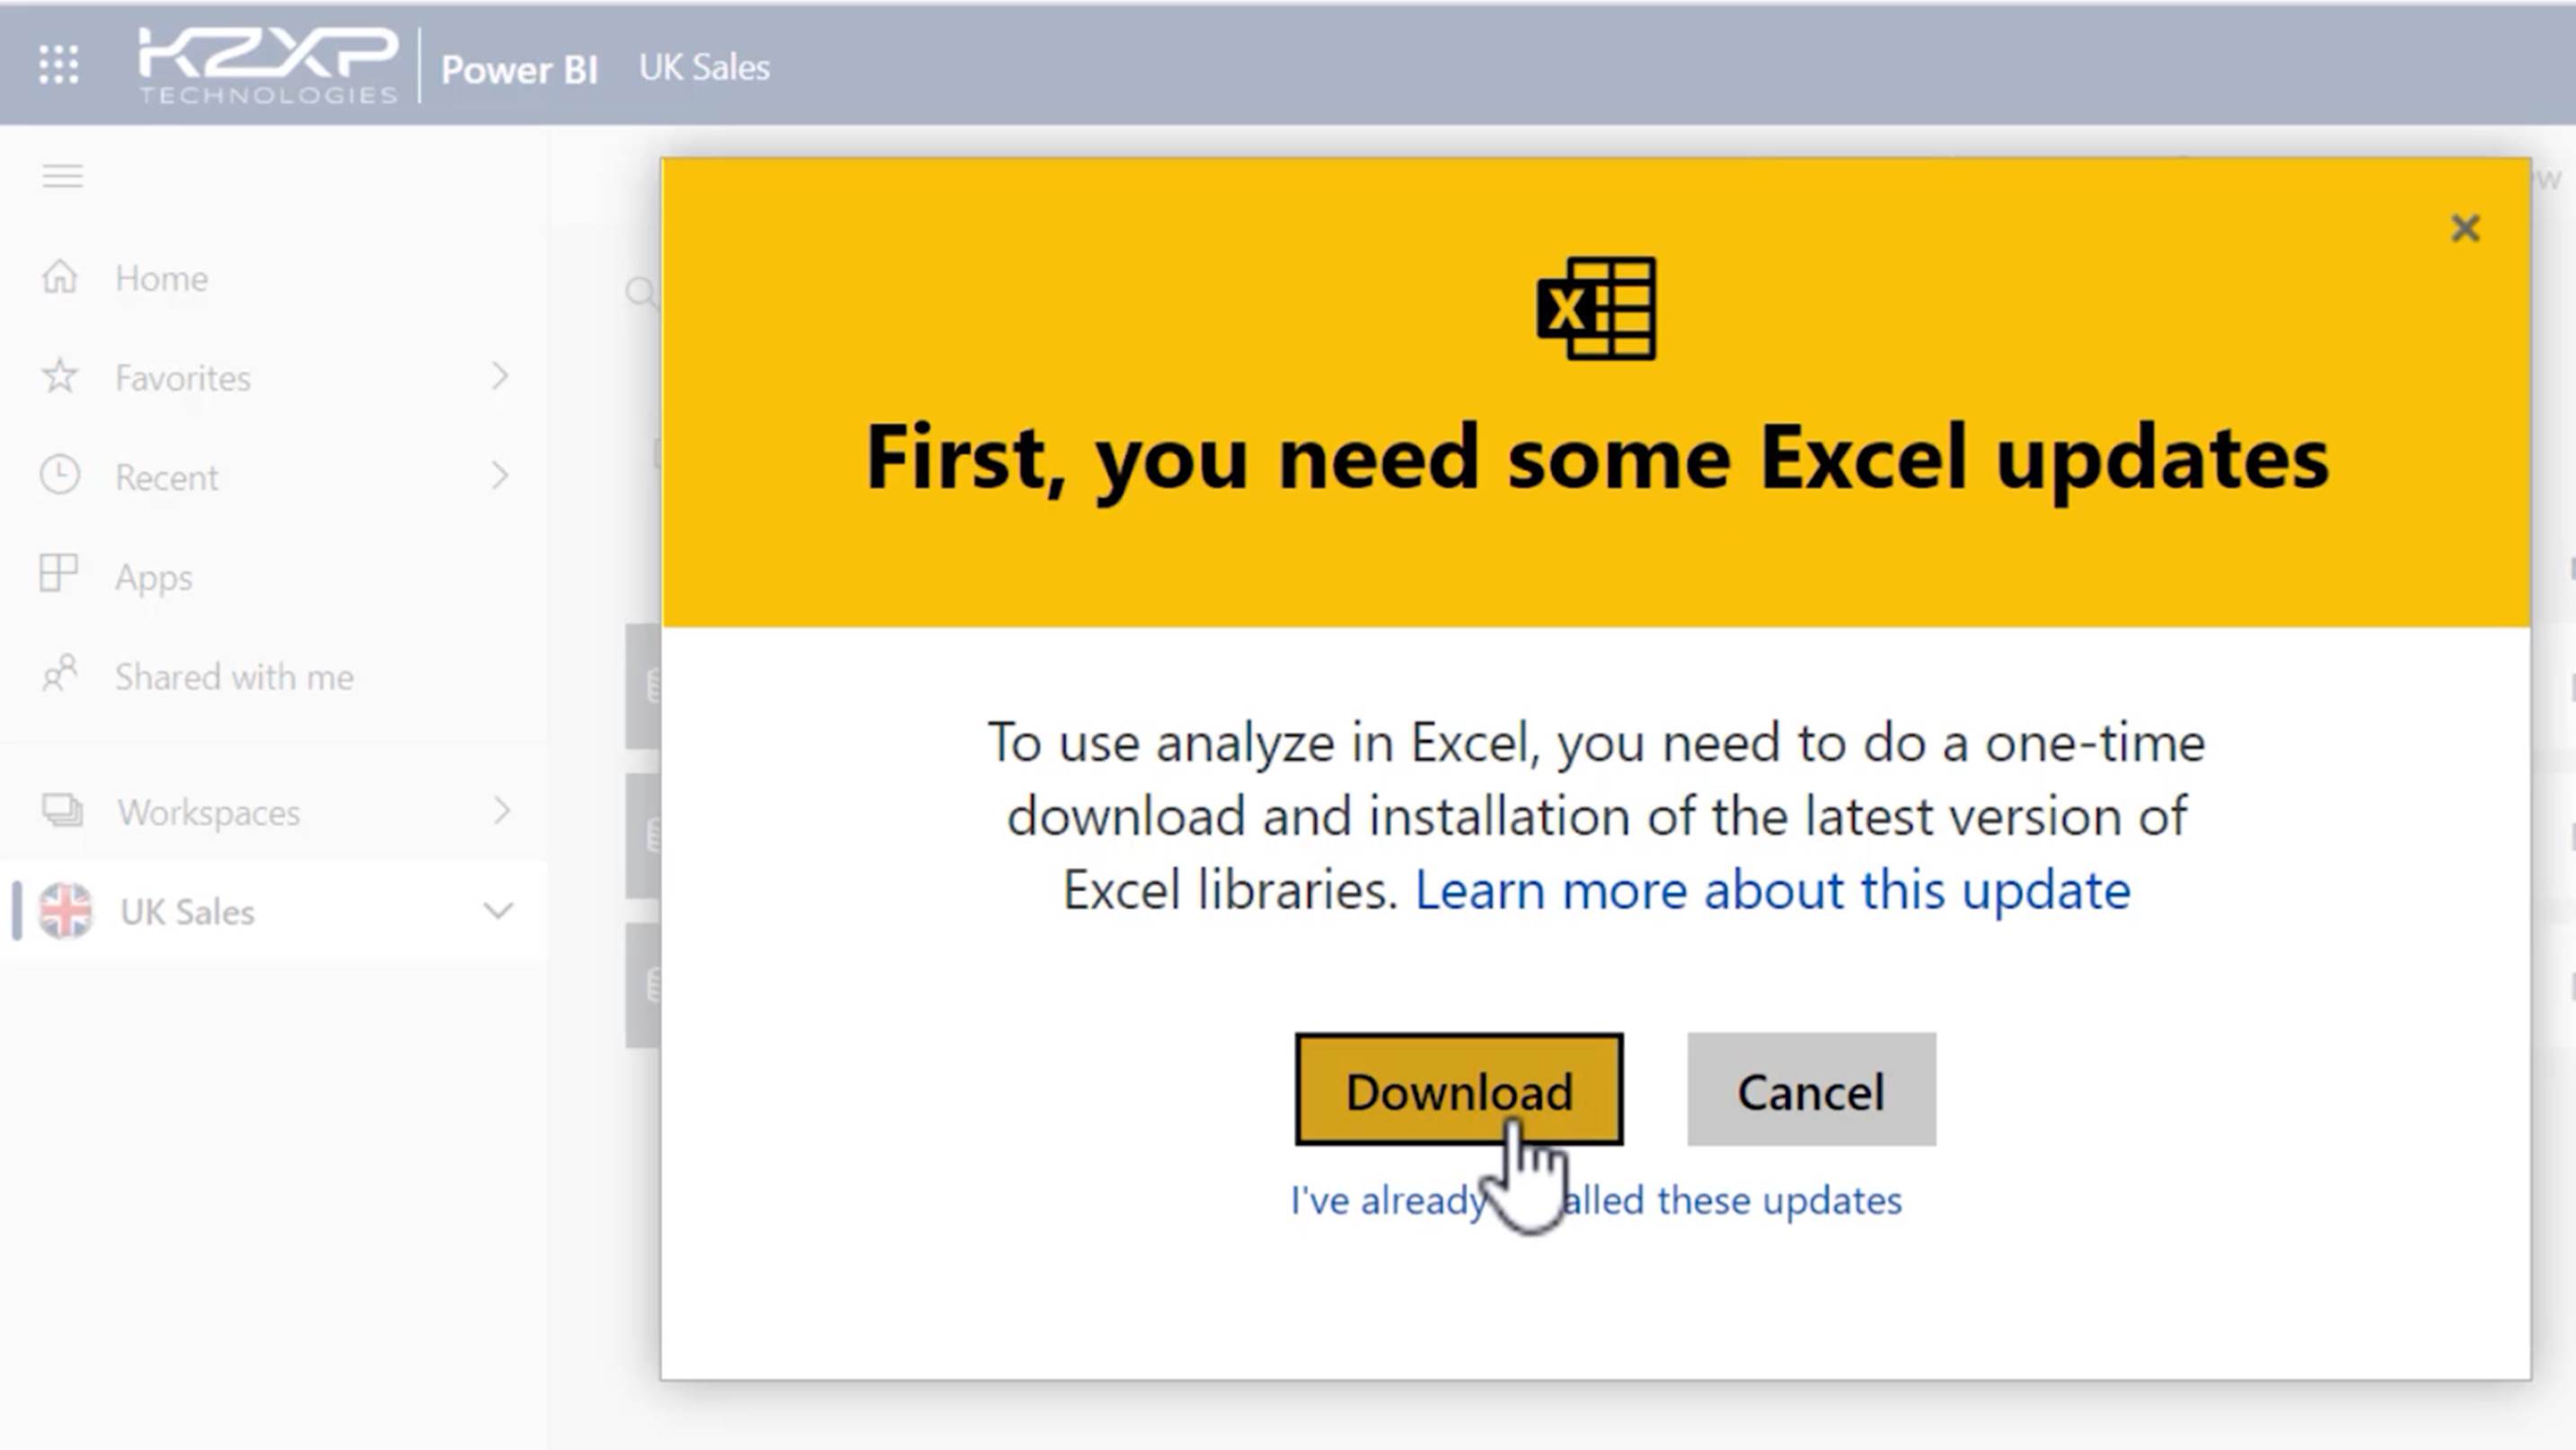
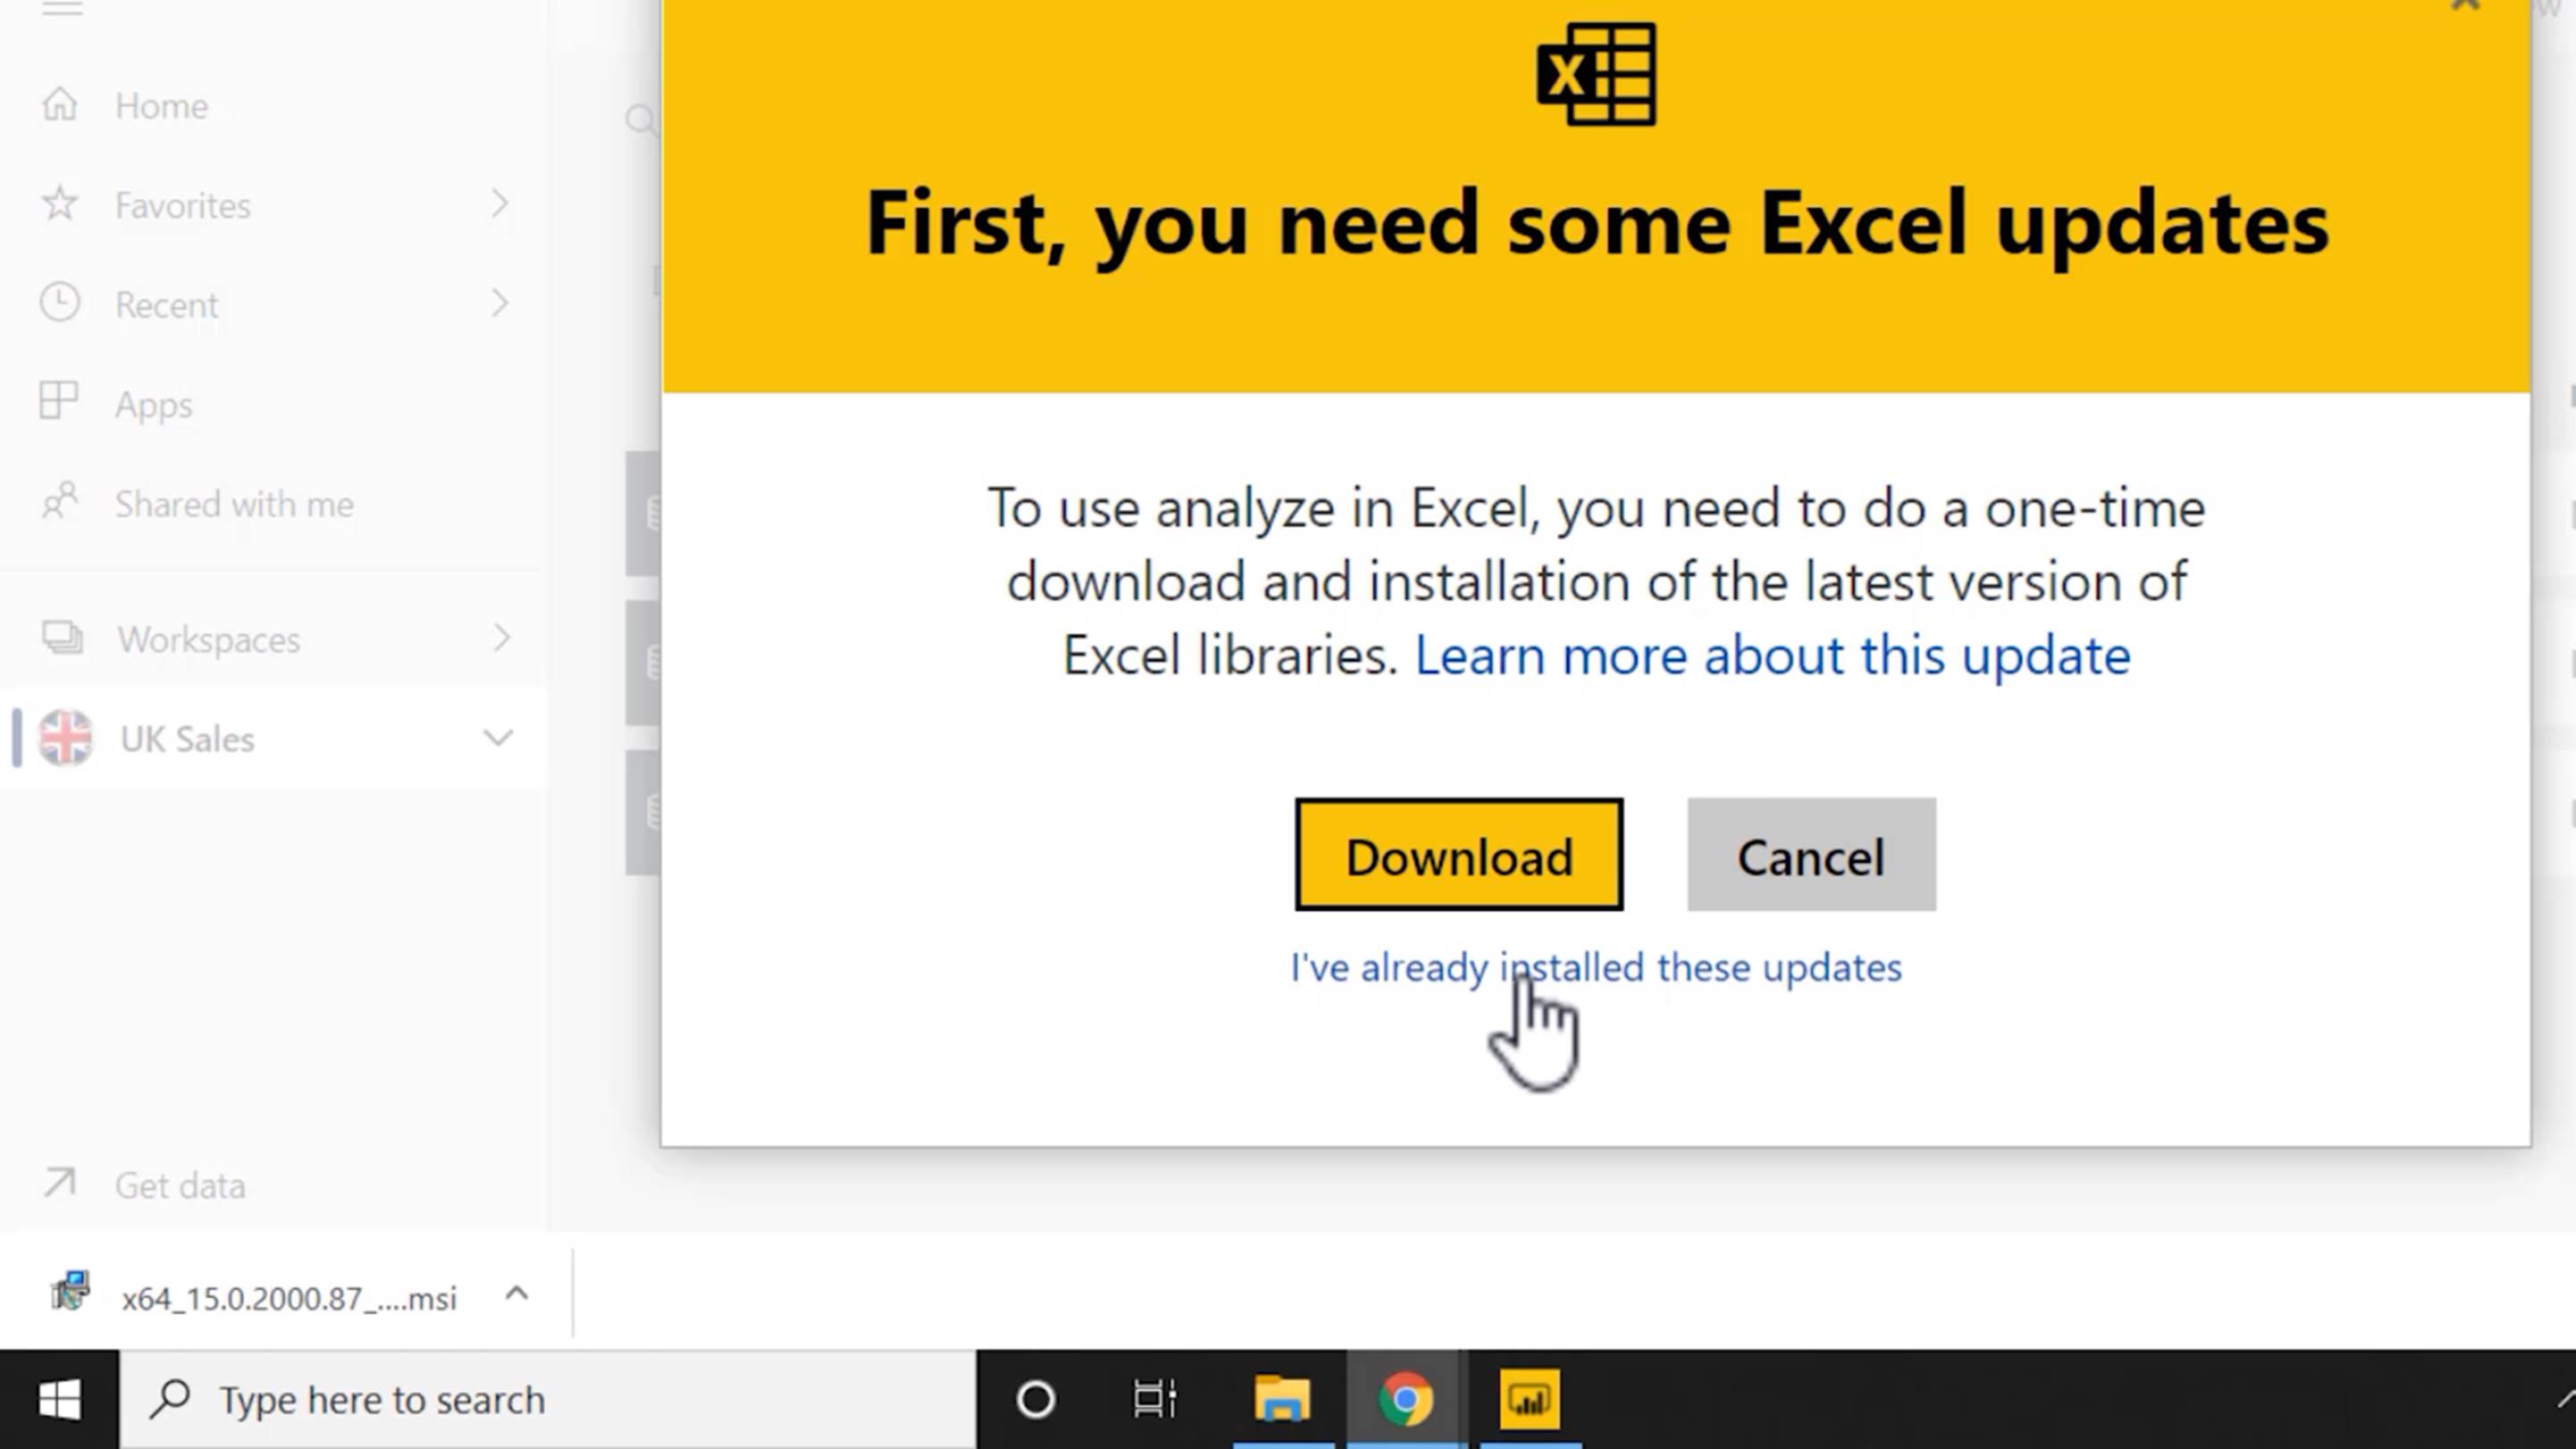
If the message pops up even after you have installed the software, click “I’ve already installed these updates”.
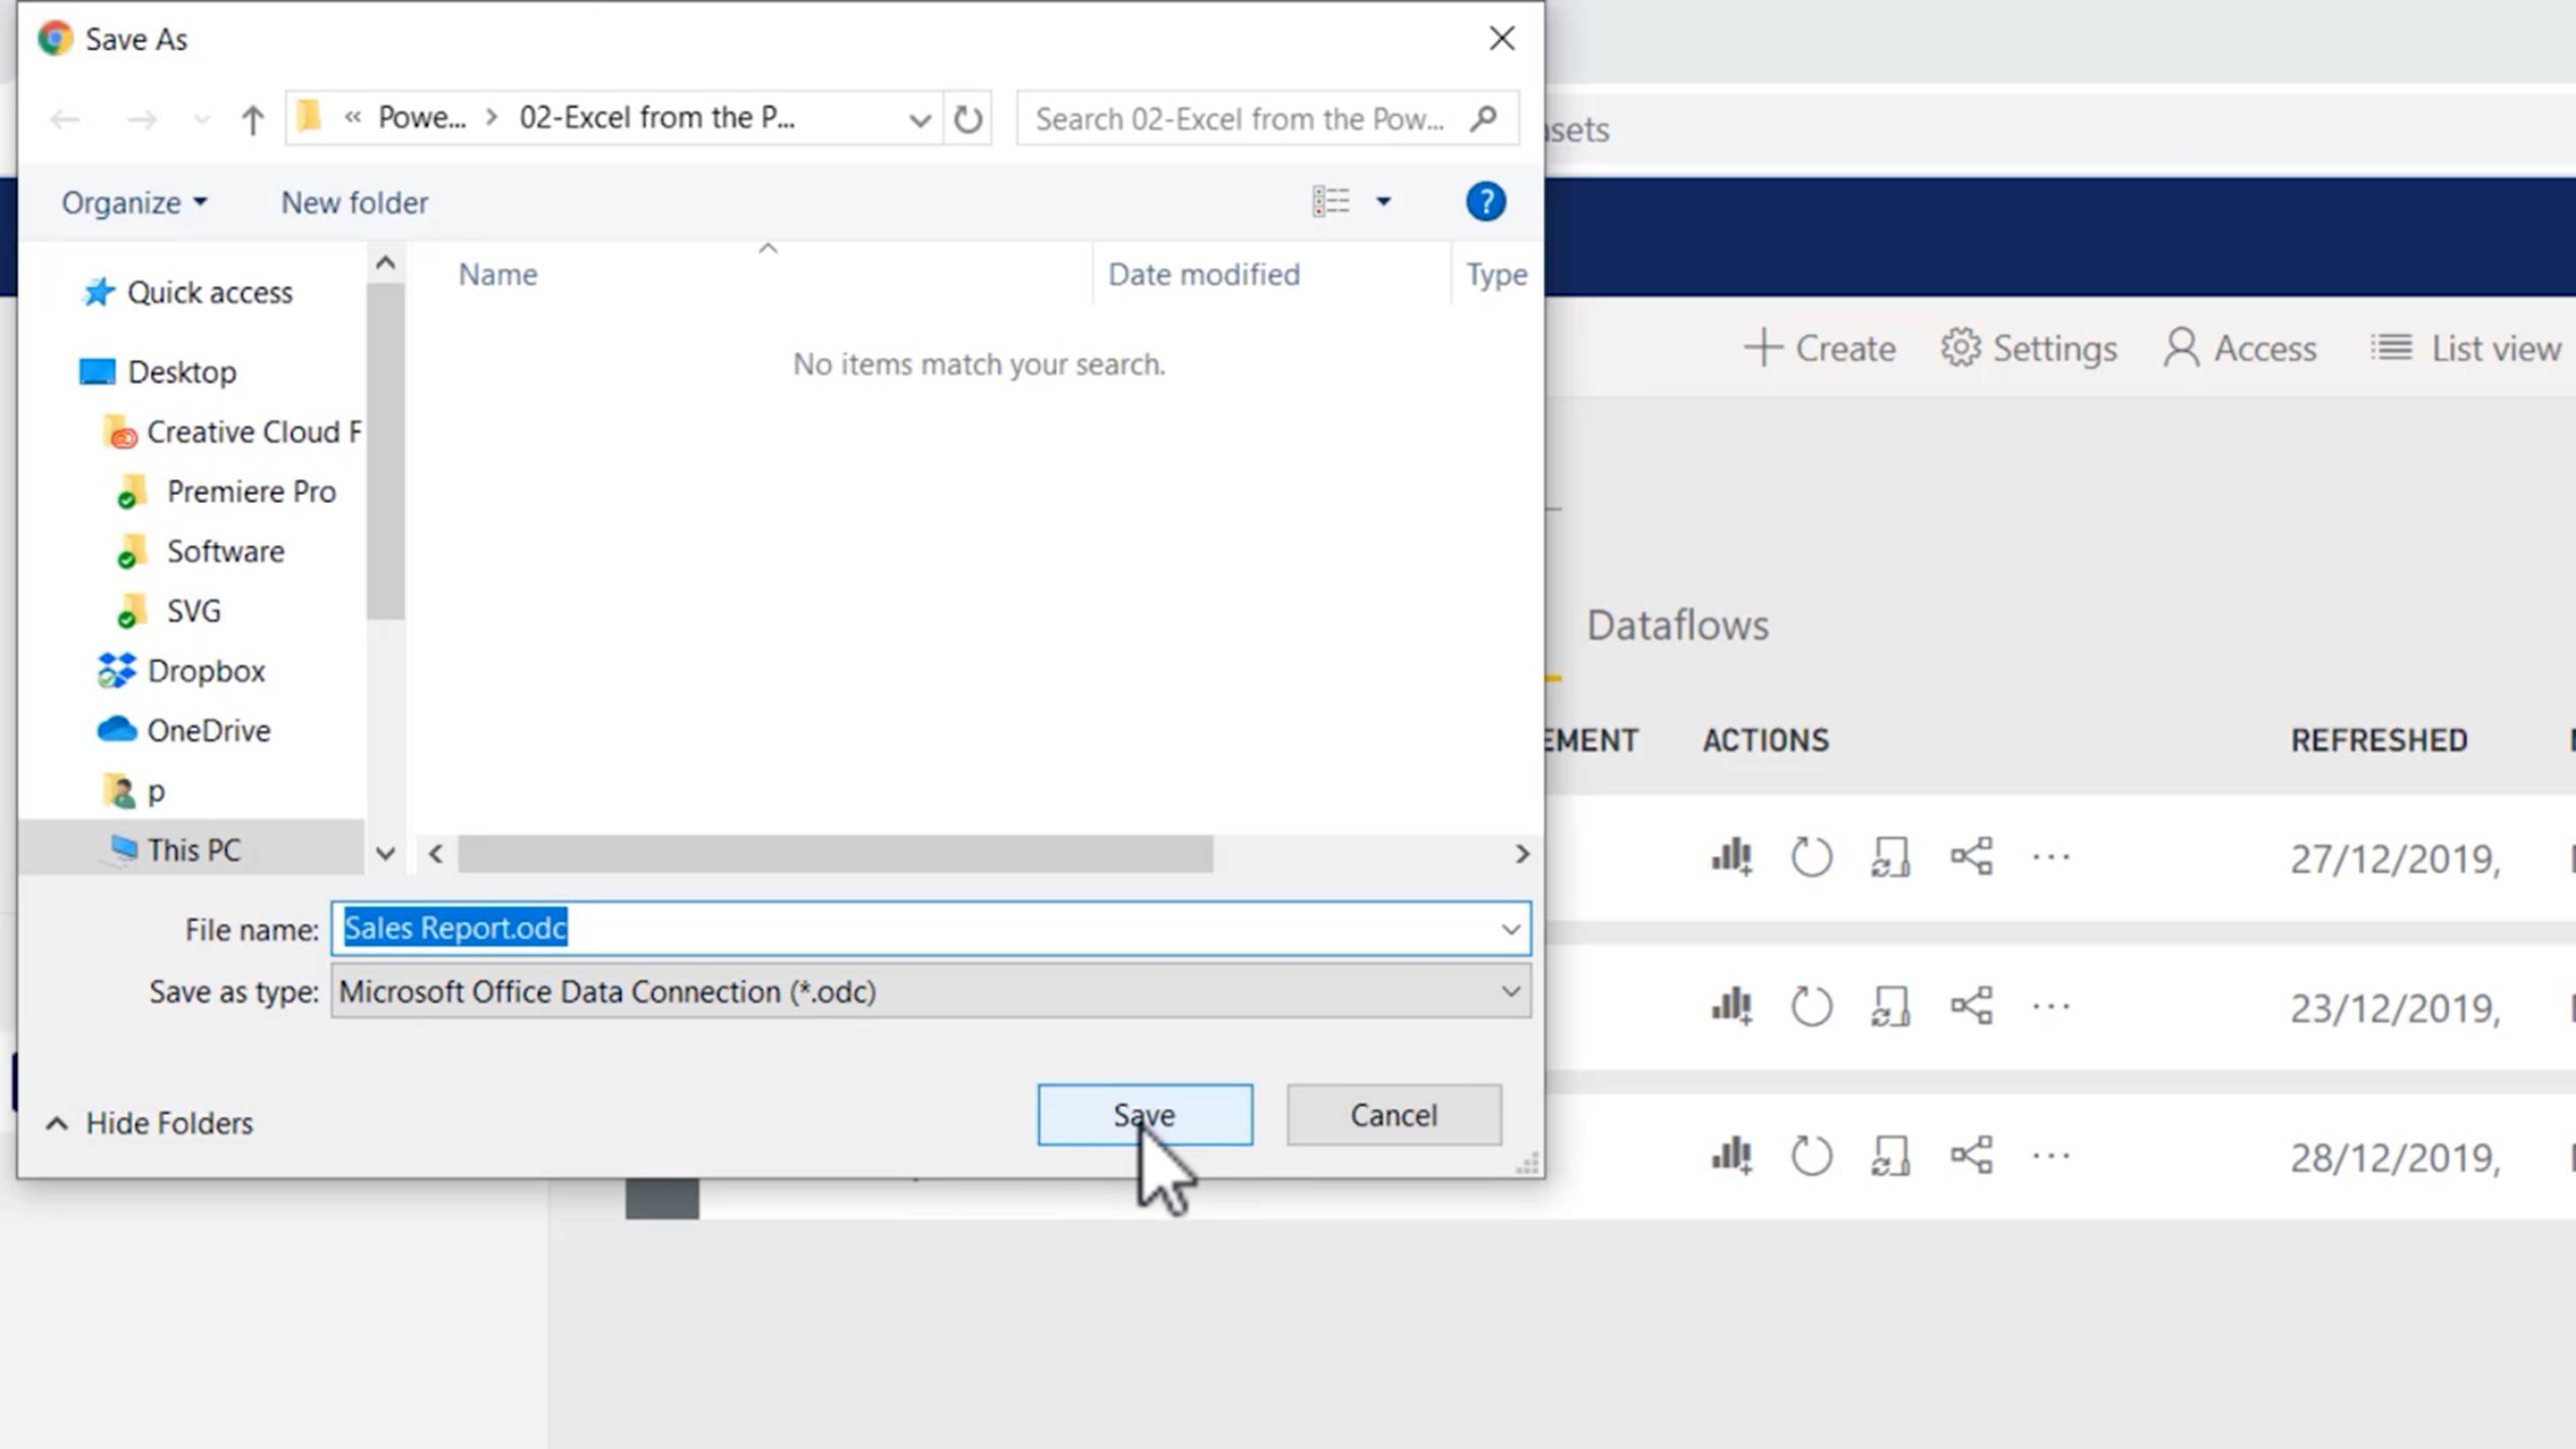
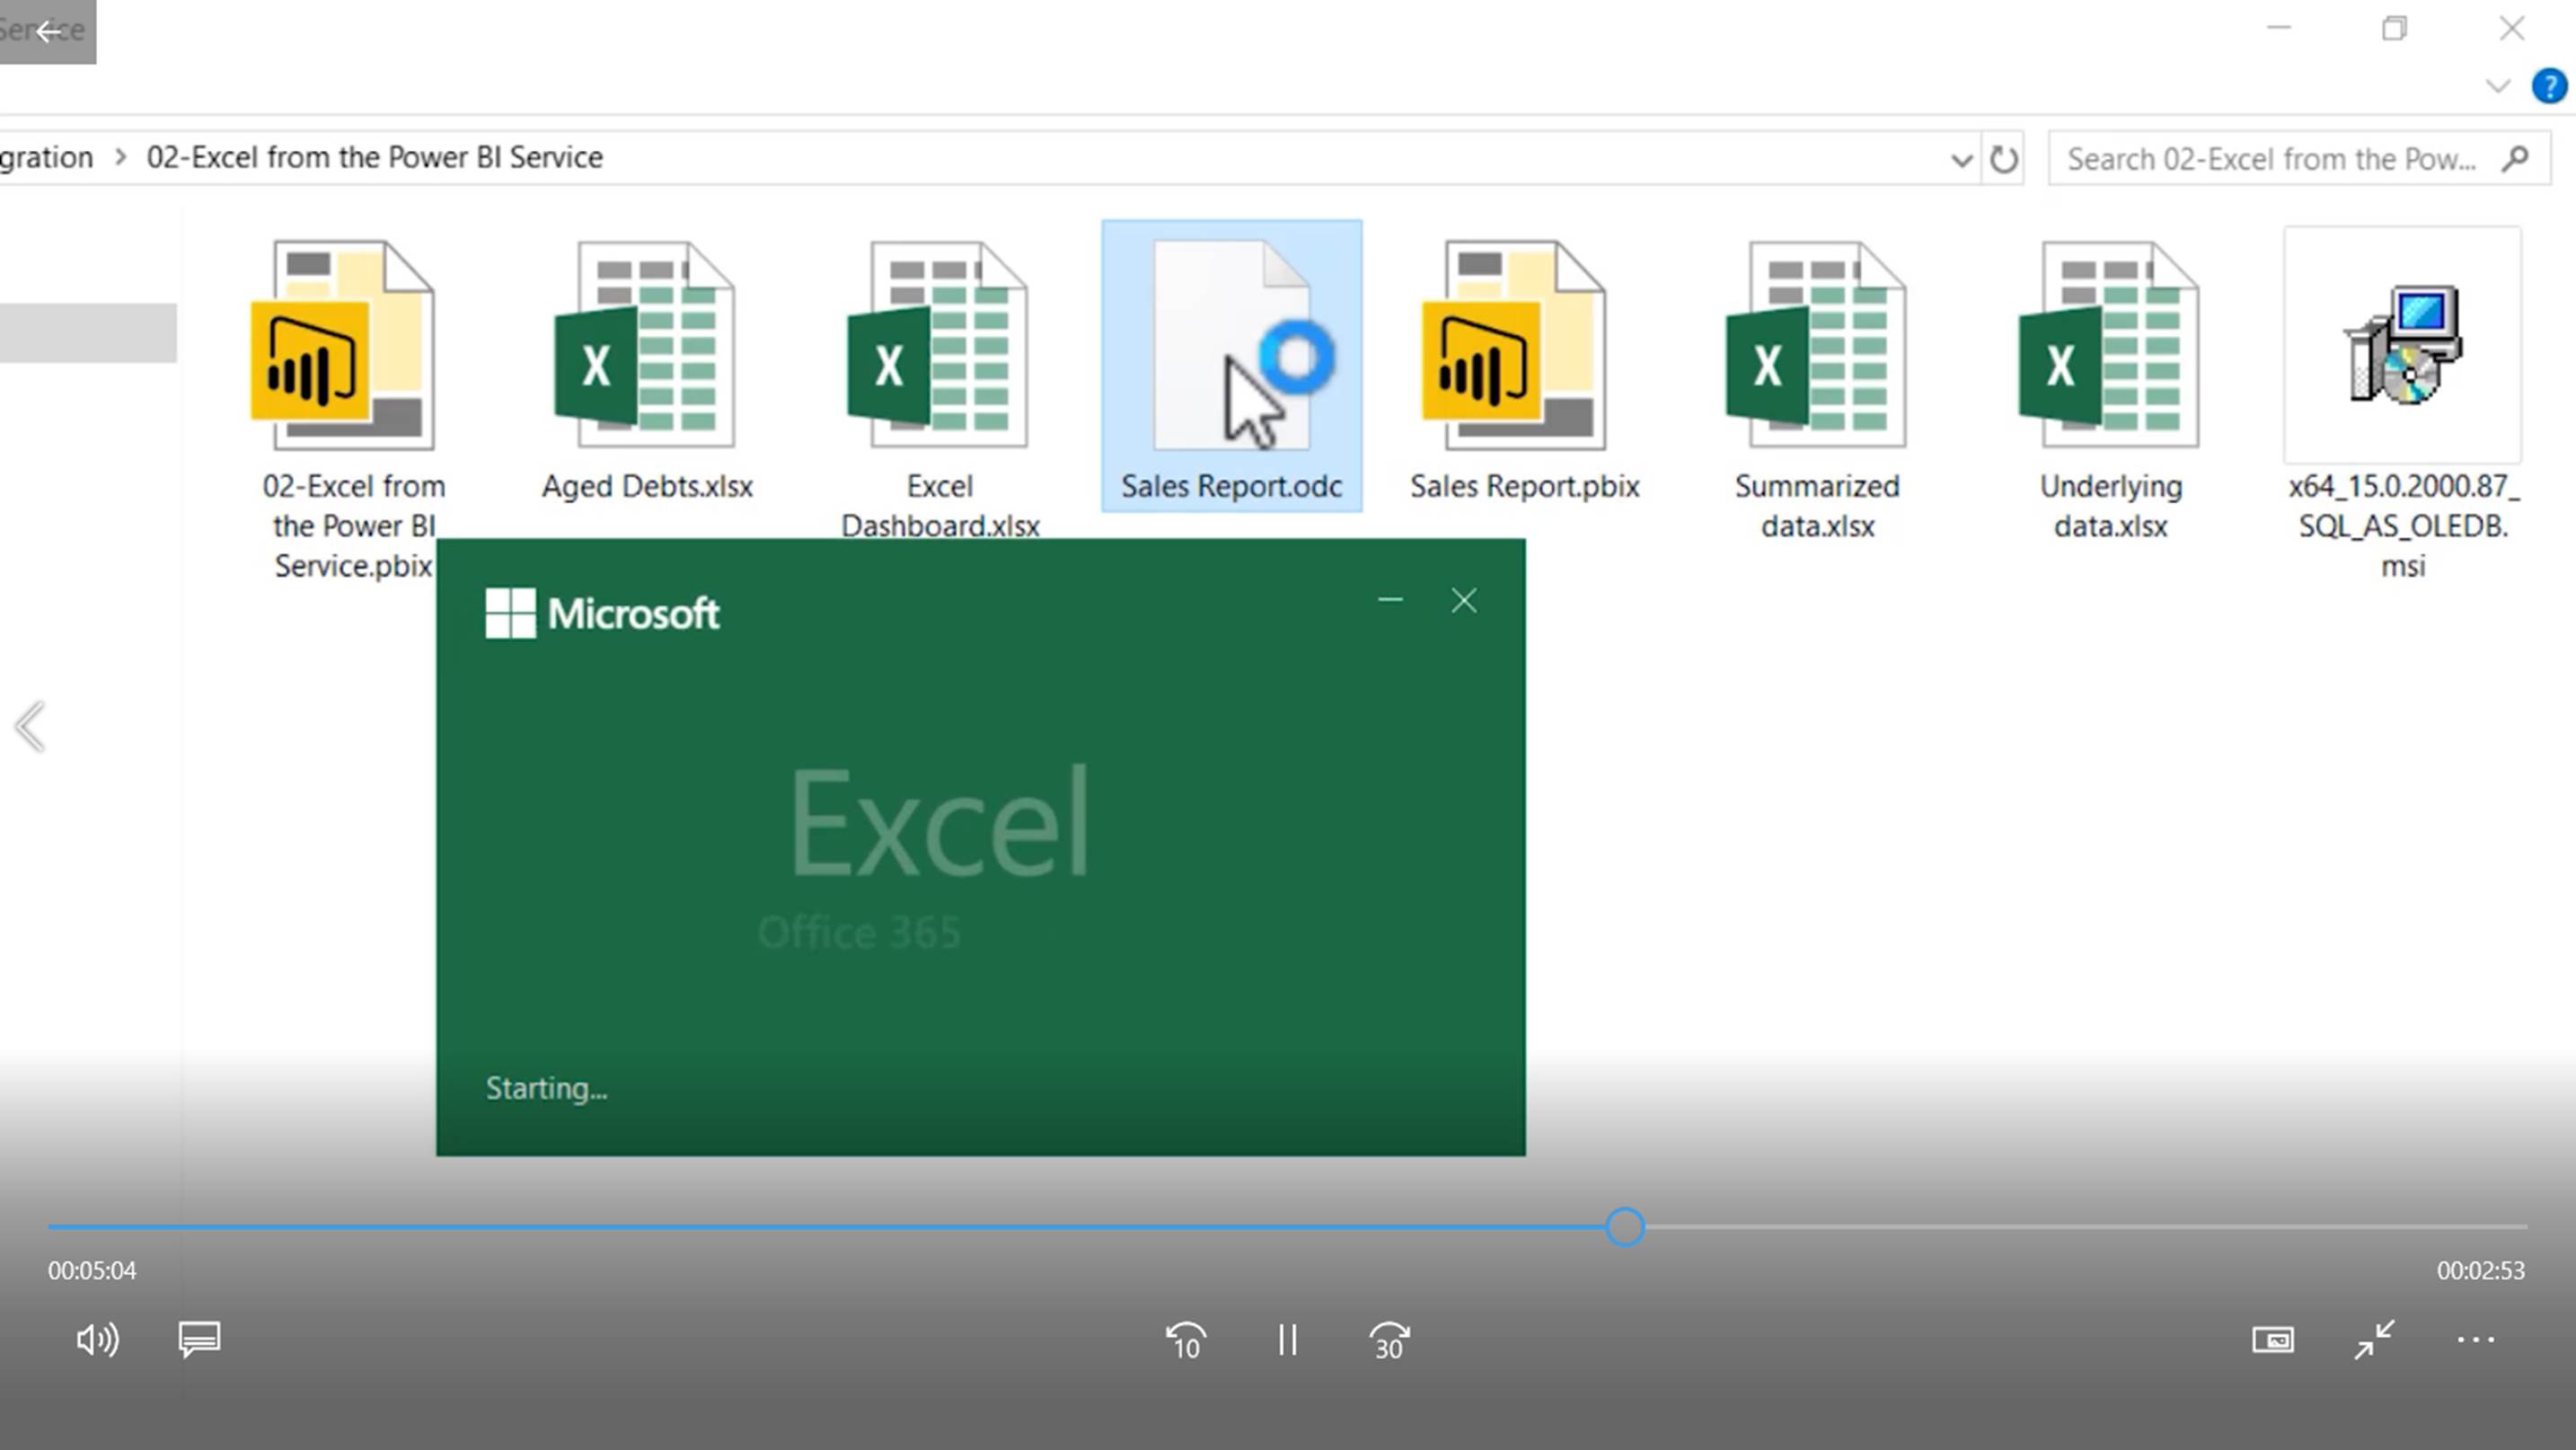
Thereafter, clicking “Analyze in Excel” will download a file with a “.odc” extension. (Save the file to any convenient location.)
When you double-click the downloaded “.odc” file, it will open in Microsoft Excel.
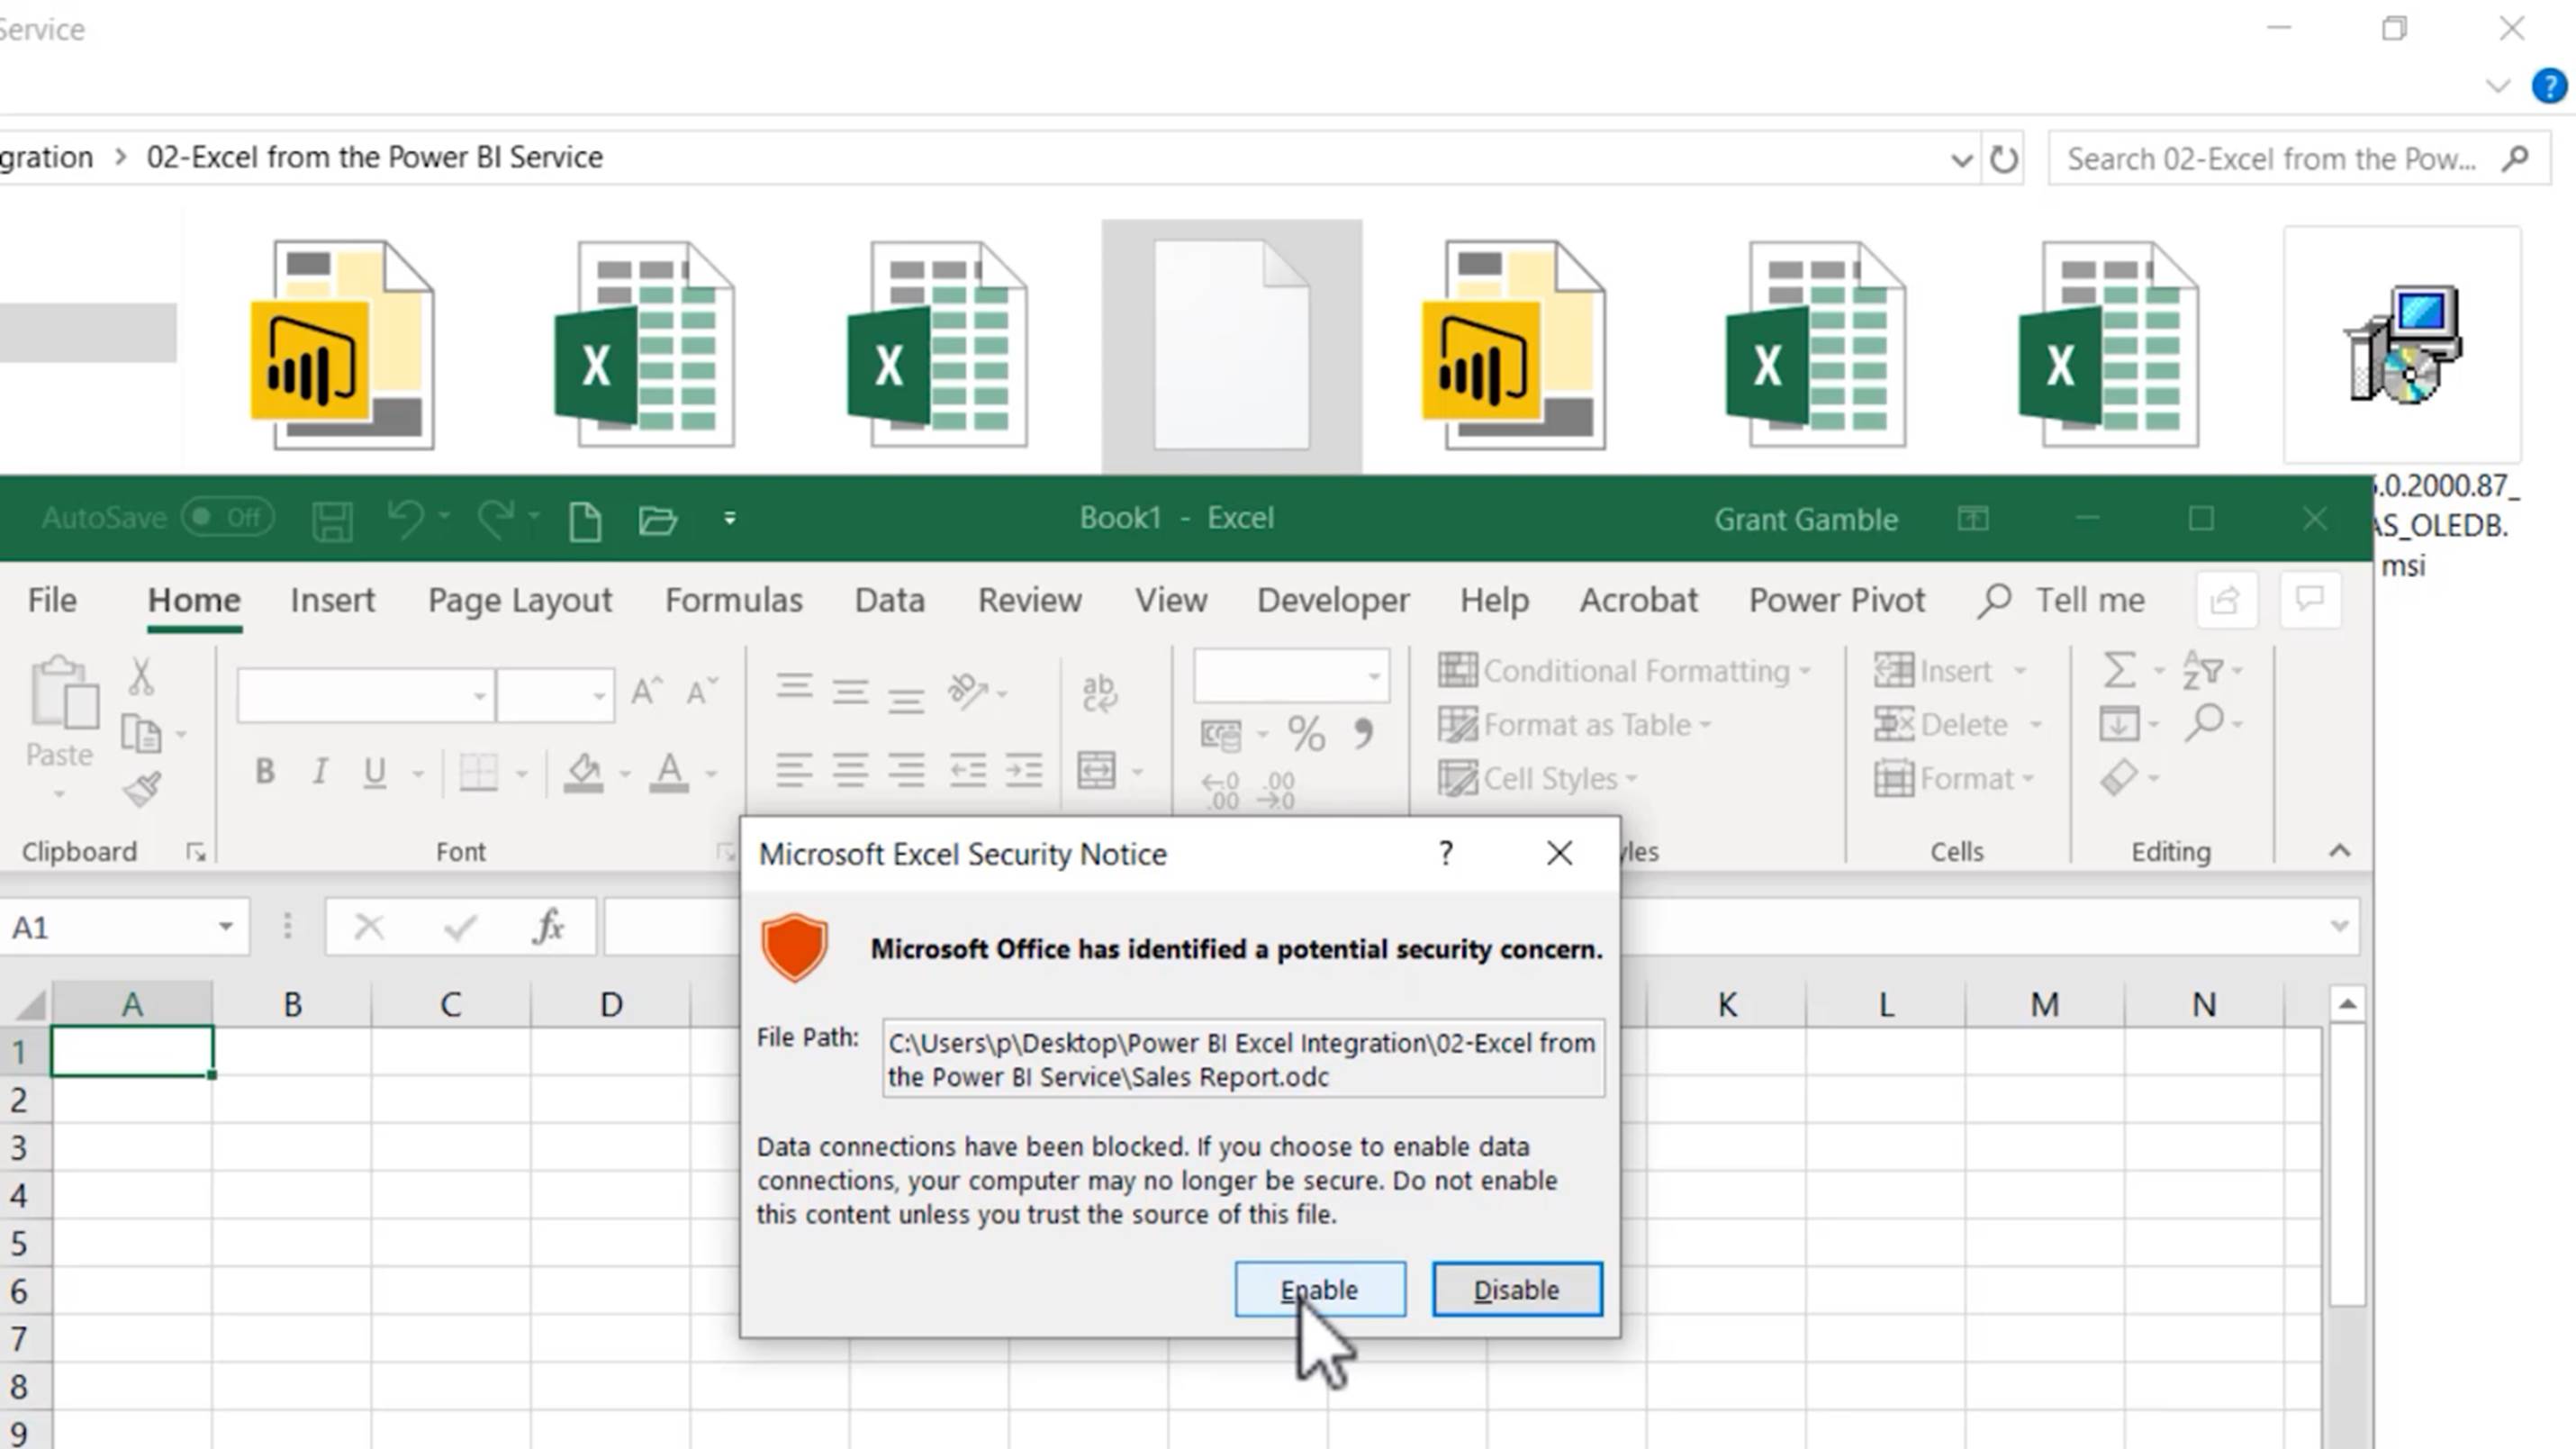
If your system displays a Microsoft Excel security notice informing you that “Data connections have been blocked…”, simply click on the “Enable” button.
If your Excel sign in is also the username with which you login to a Power BI tenant different to the one from which the “.odc” file was downloaded, you will see this error.
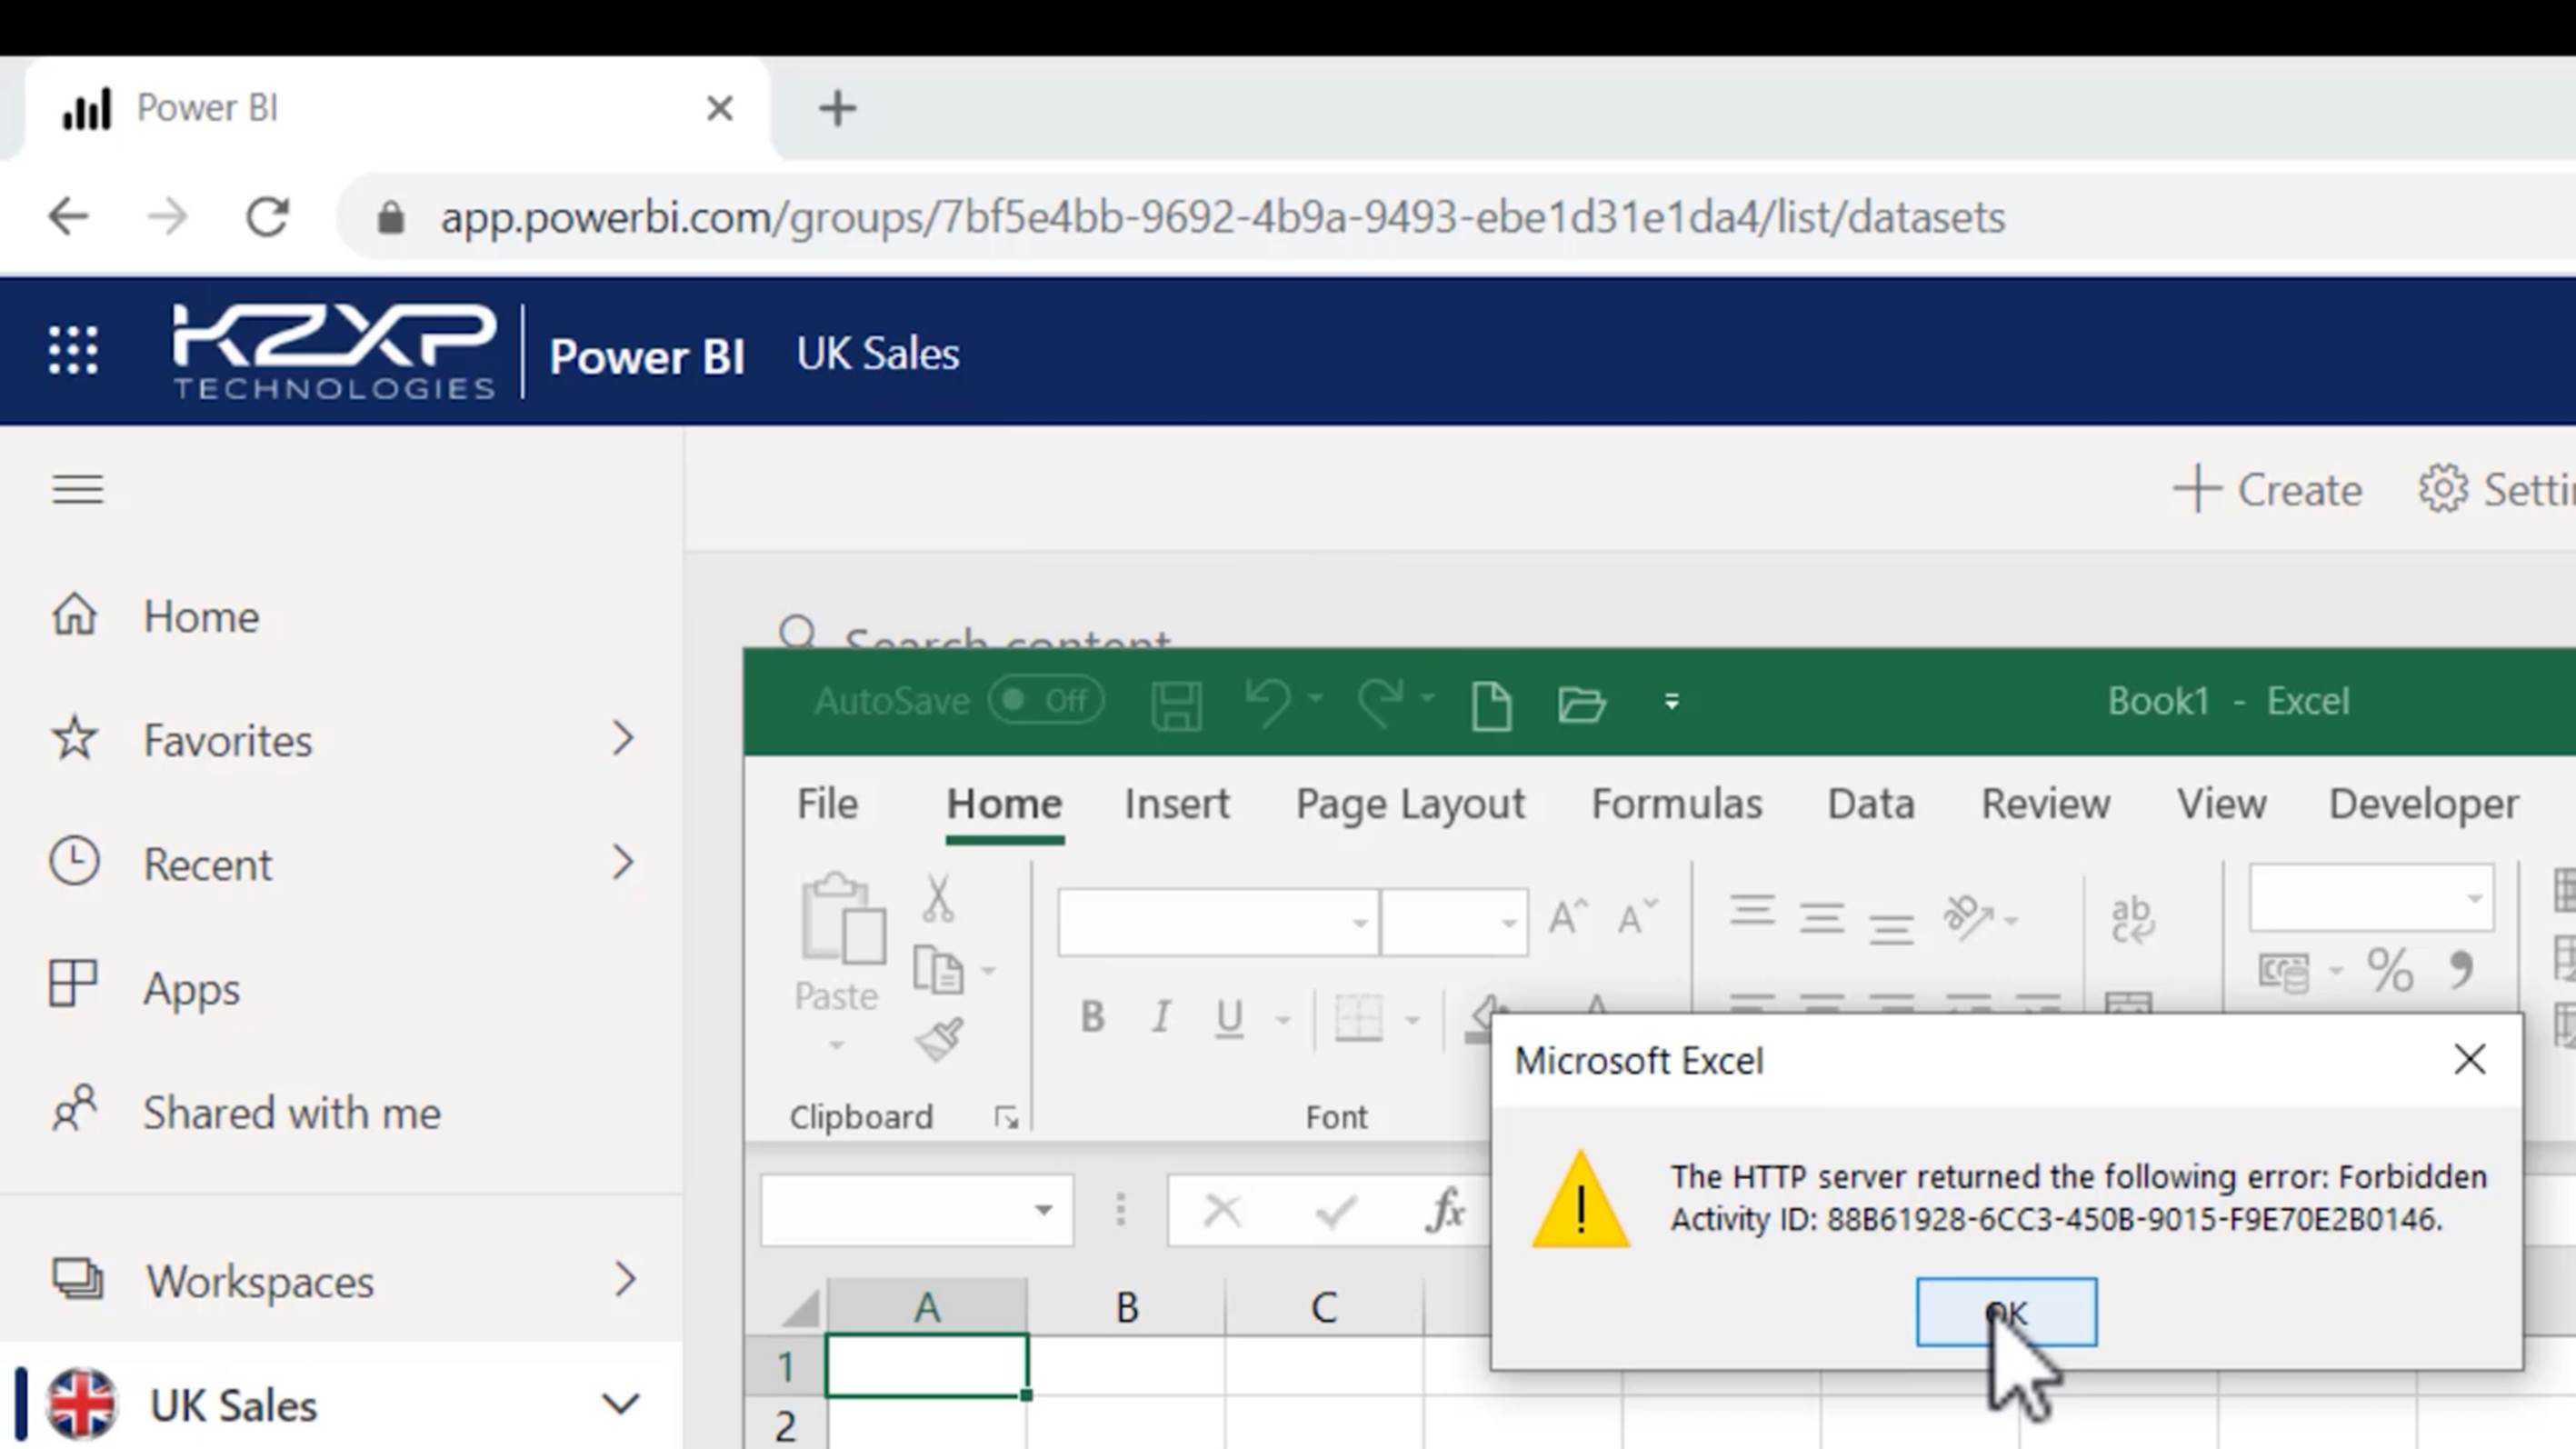
Simply click “OK” to dismiss the message and then sign in to the Power BI tenant from which the “.odc” file was downloaded.

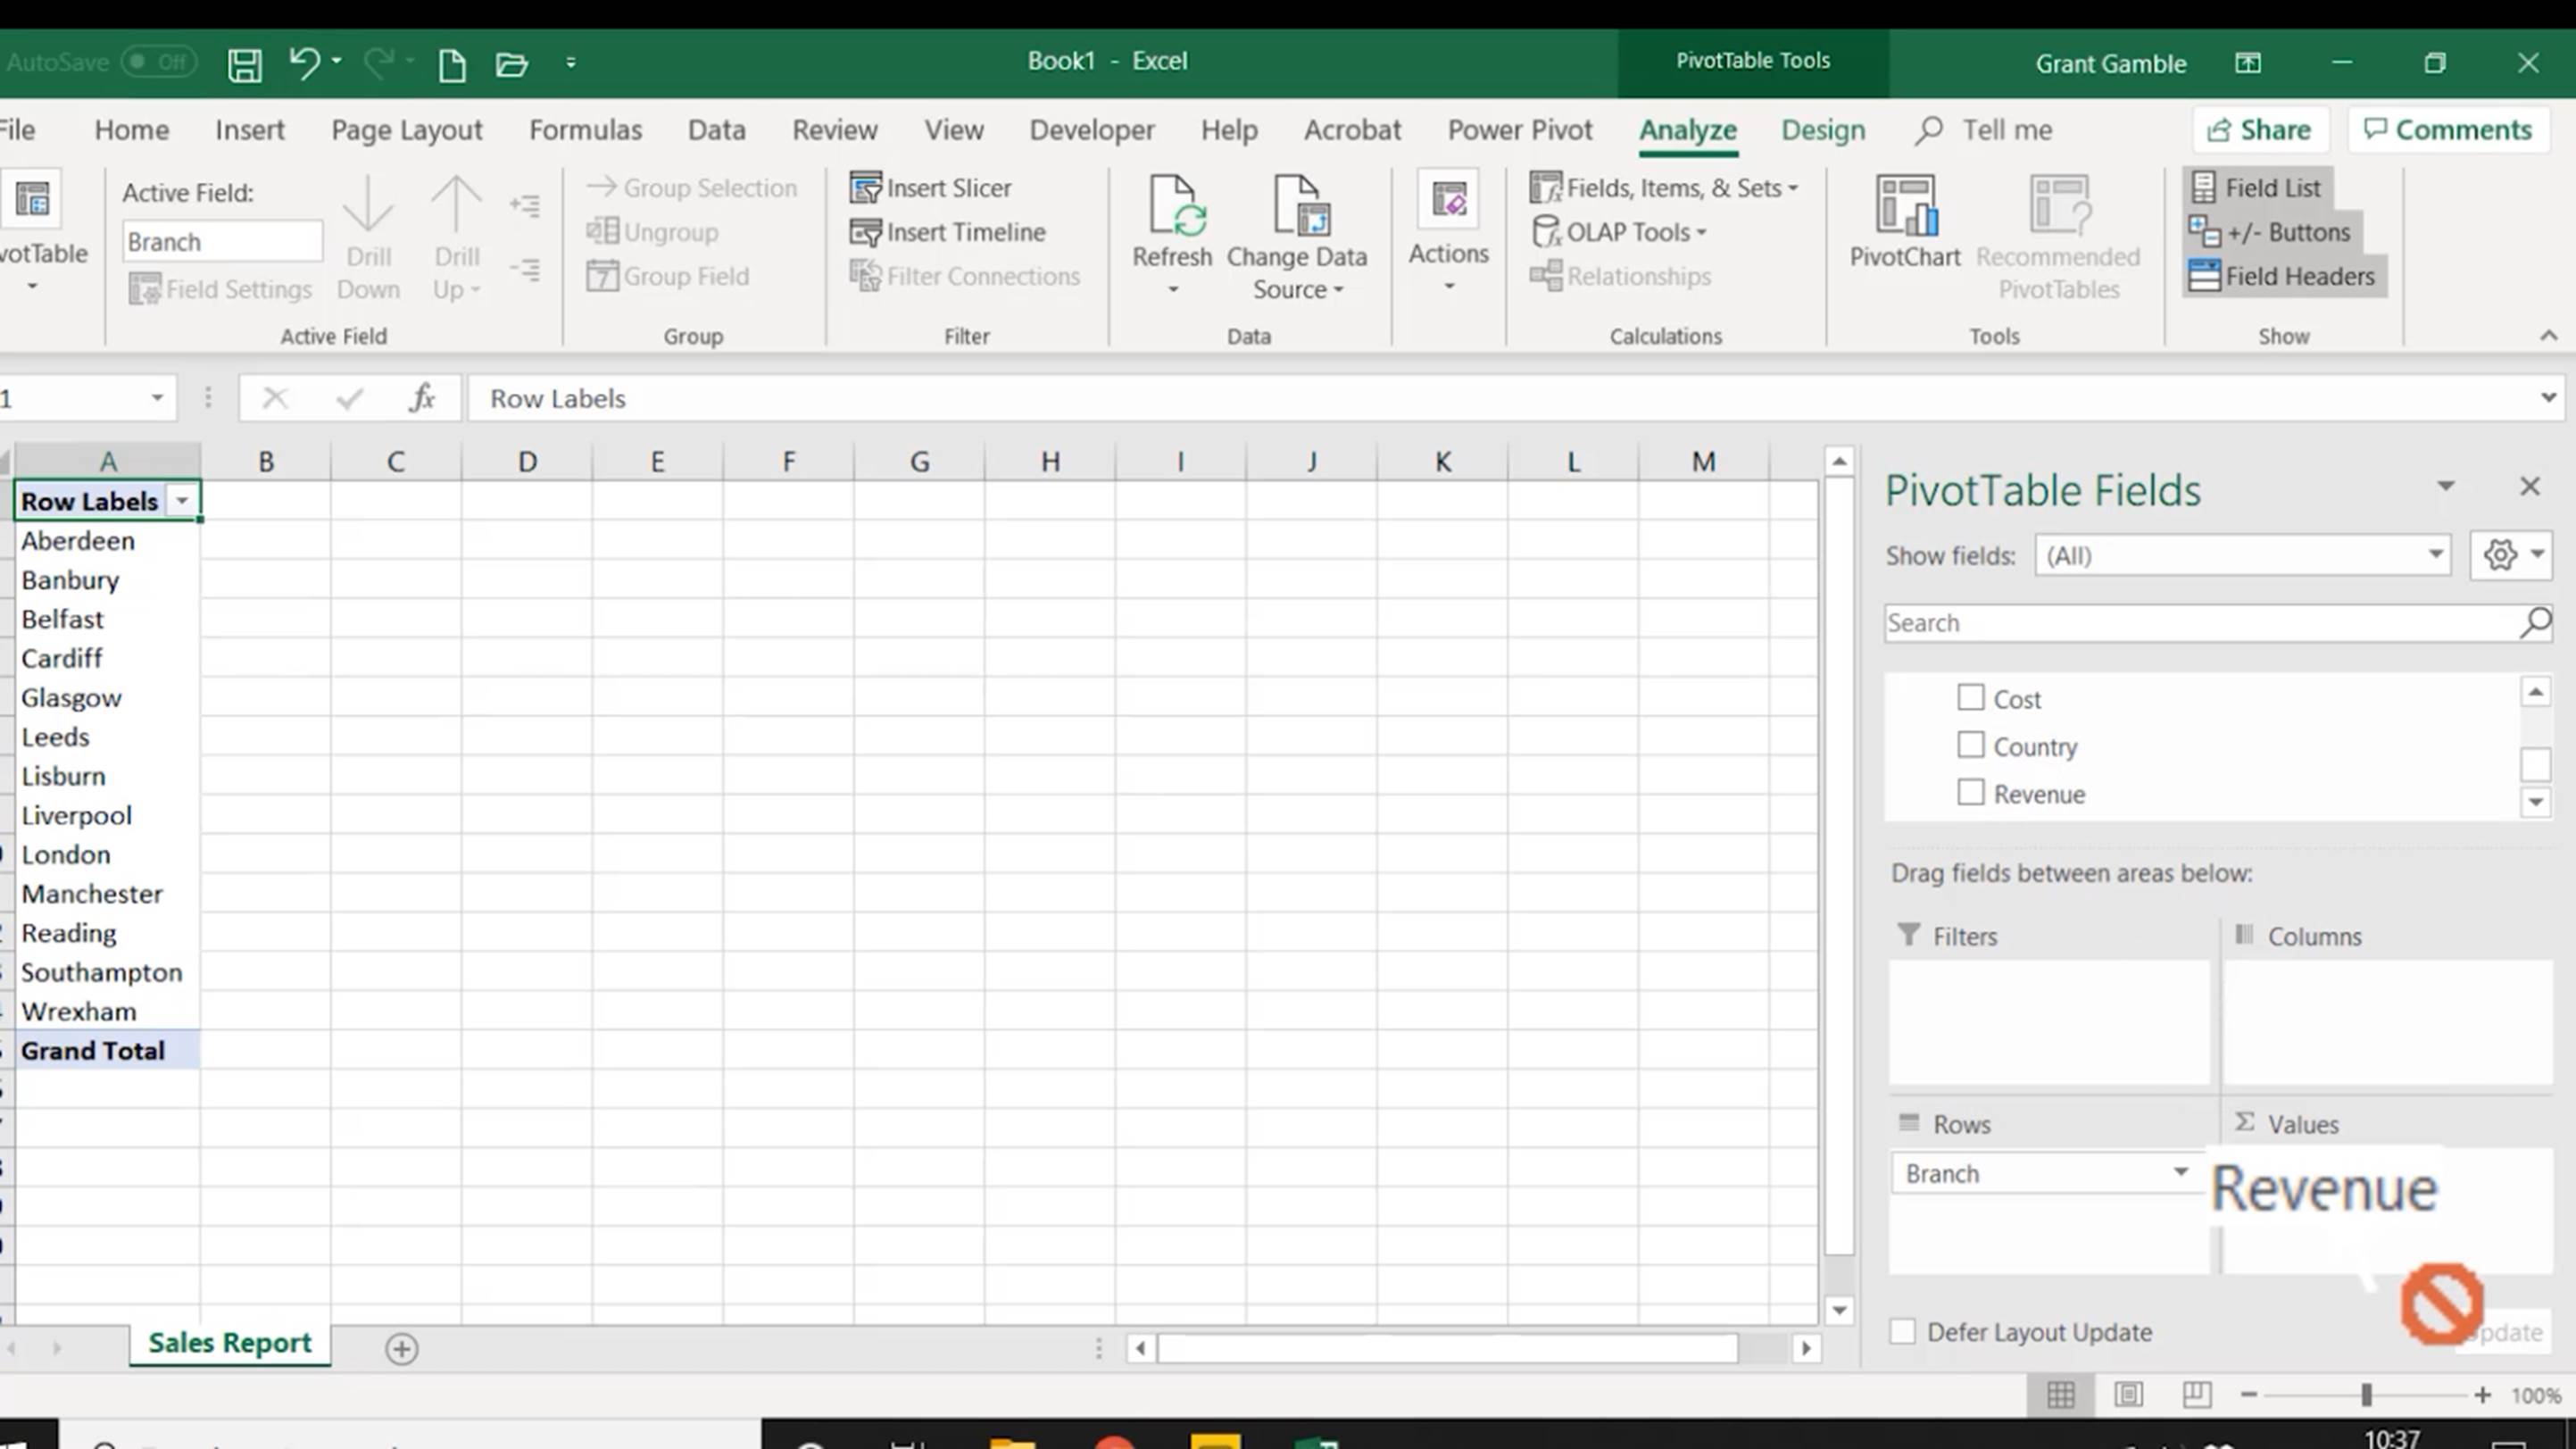
When the file does finally open, it will contain a report consisting of a blank pivot table ready to be populated with fields from the Power BI dataset.
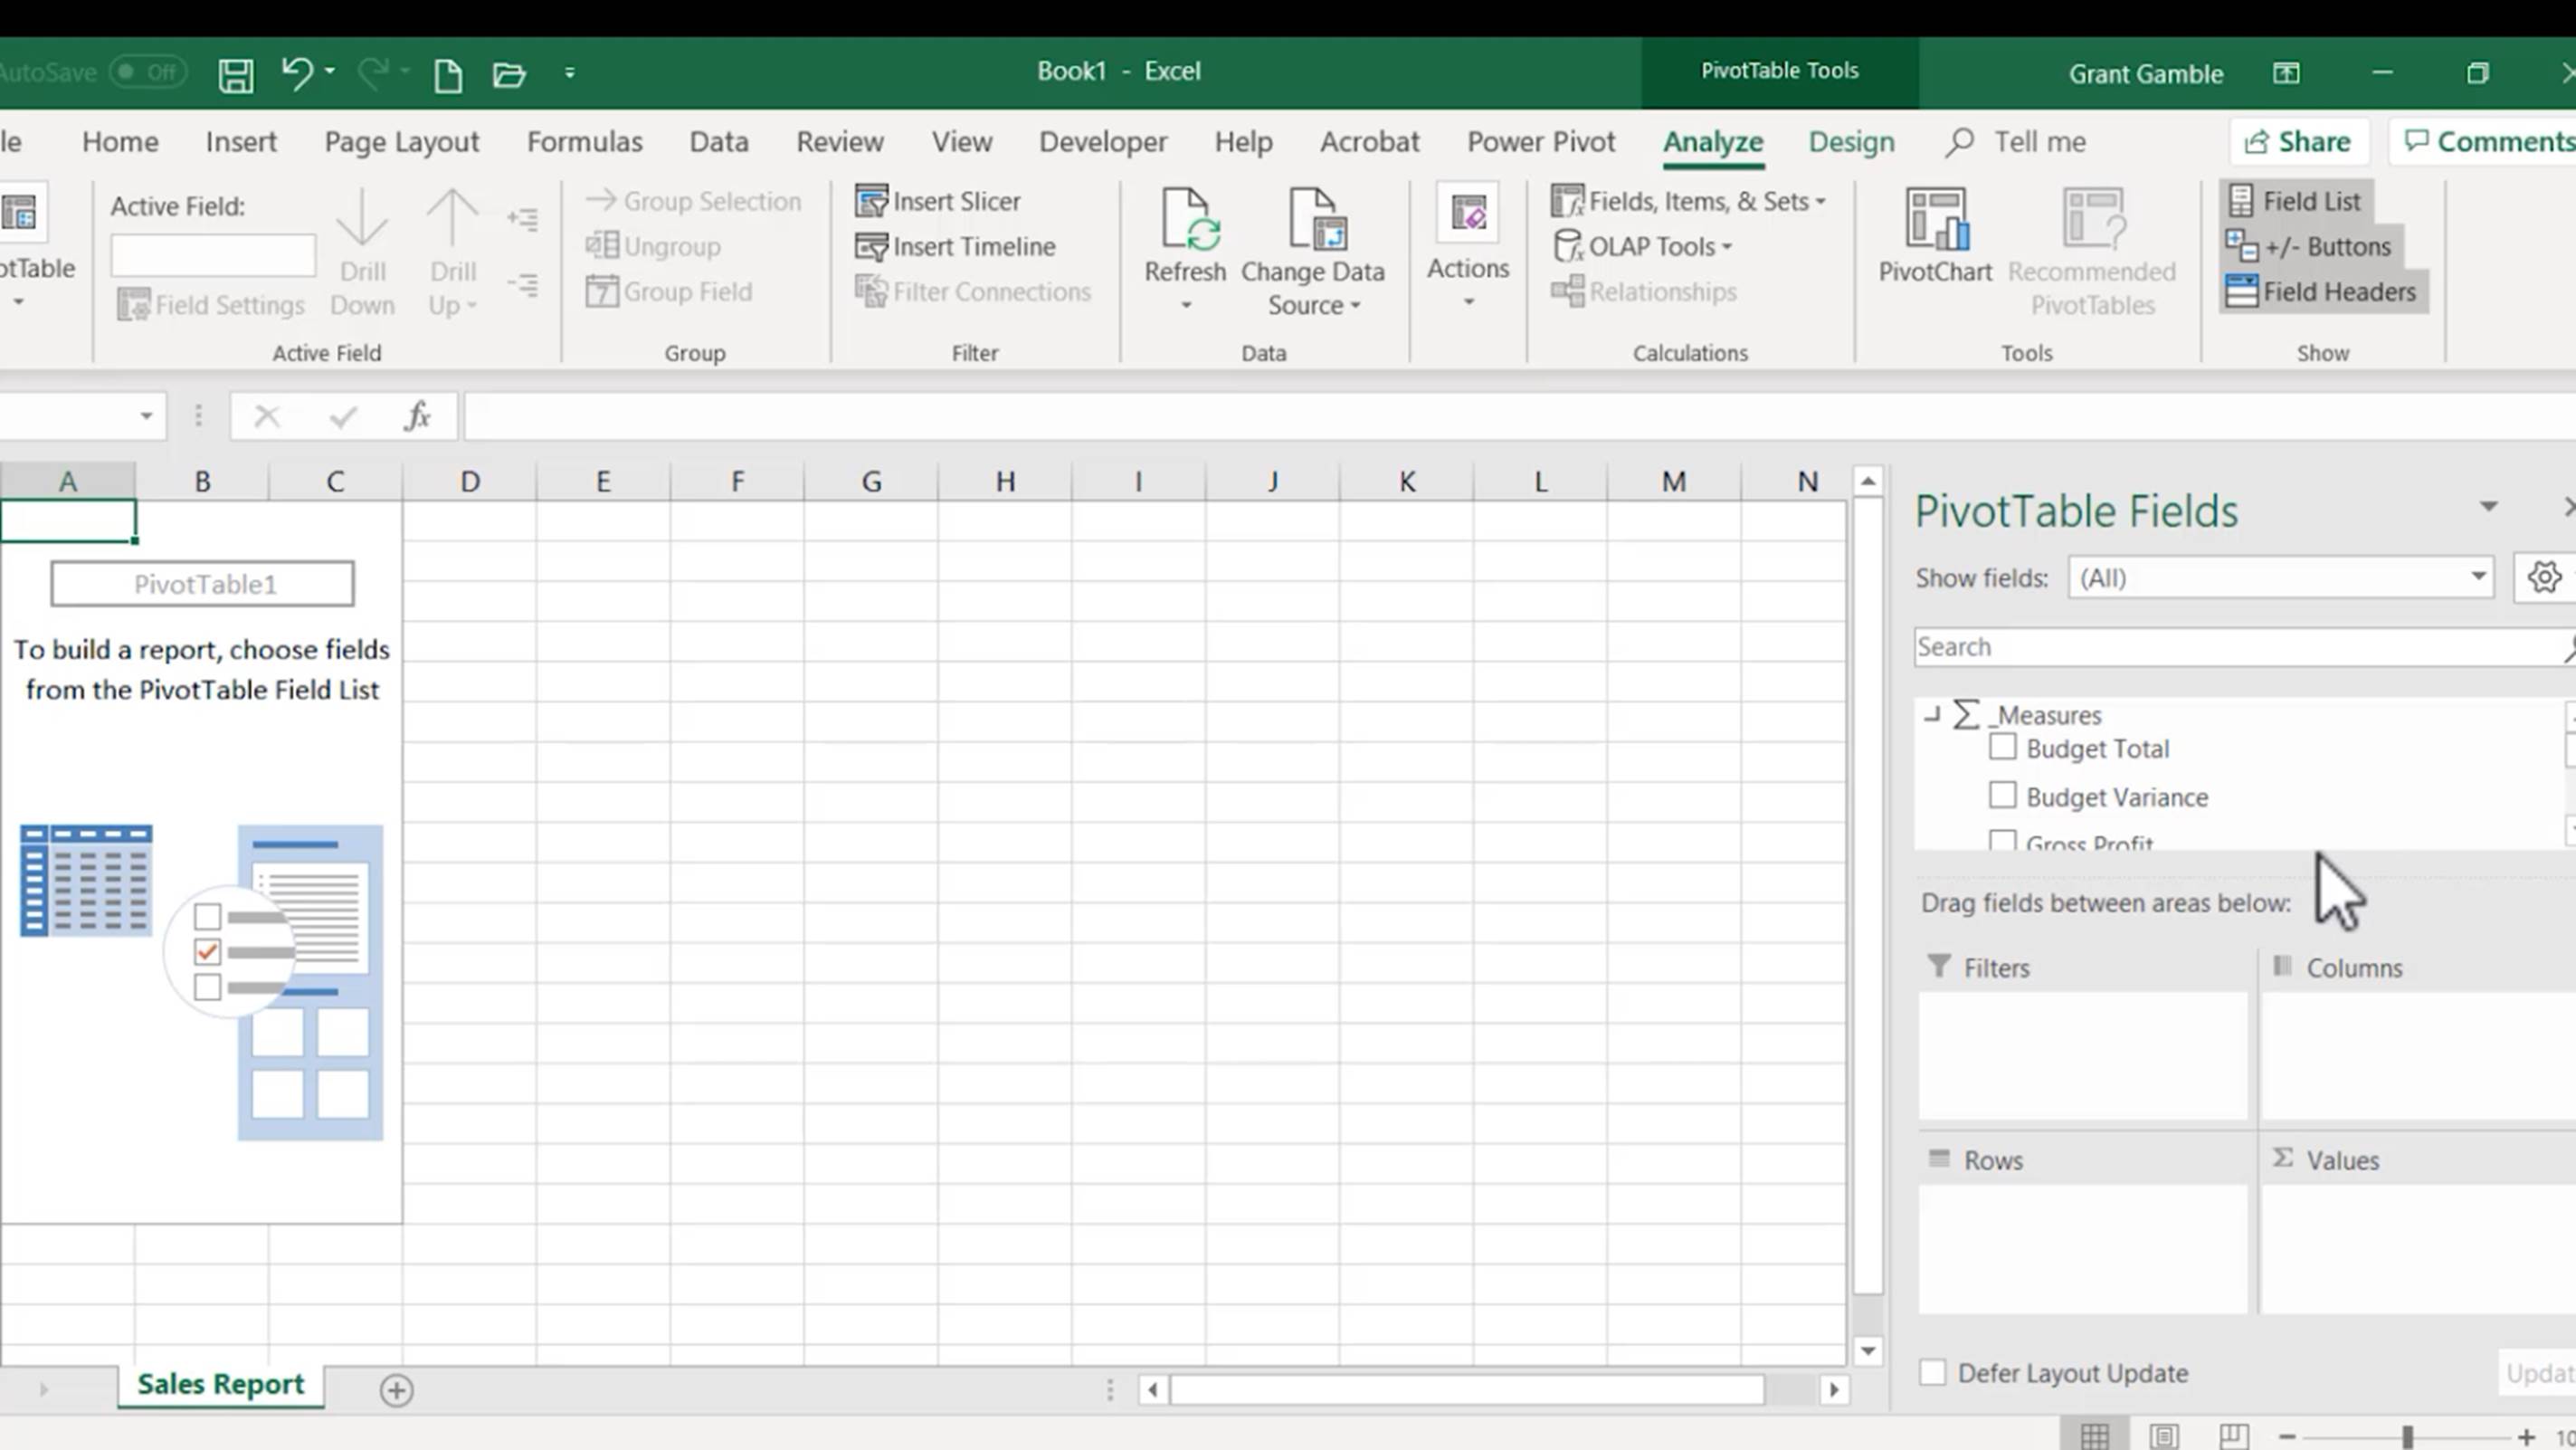
The only key difference between building a report from a Power BI dataset, and from a native Excel source, is that numeric columns cannot be dragged into the values area.
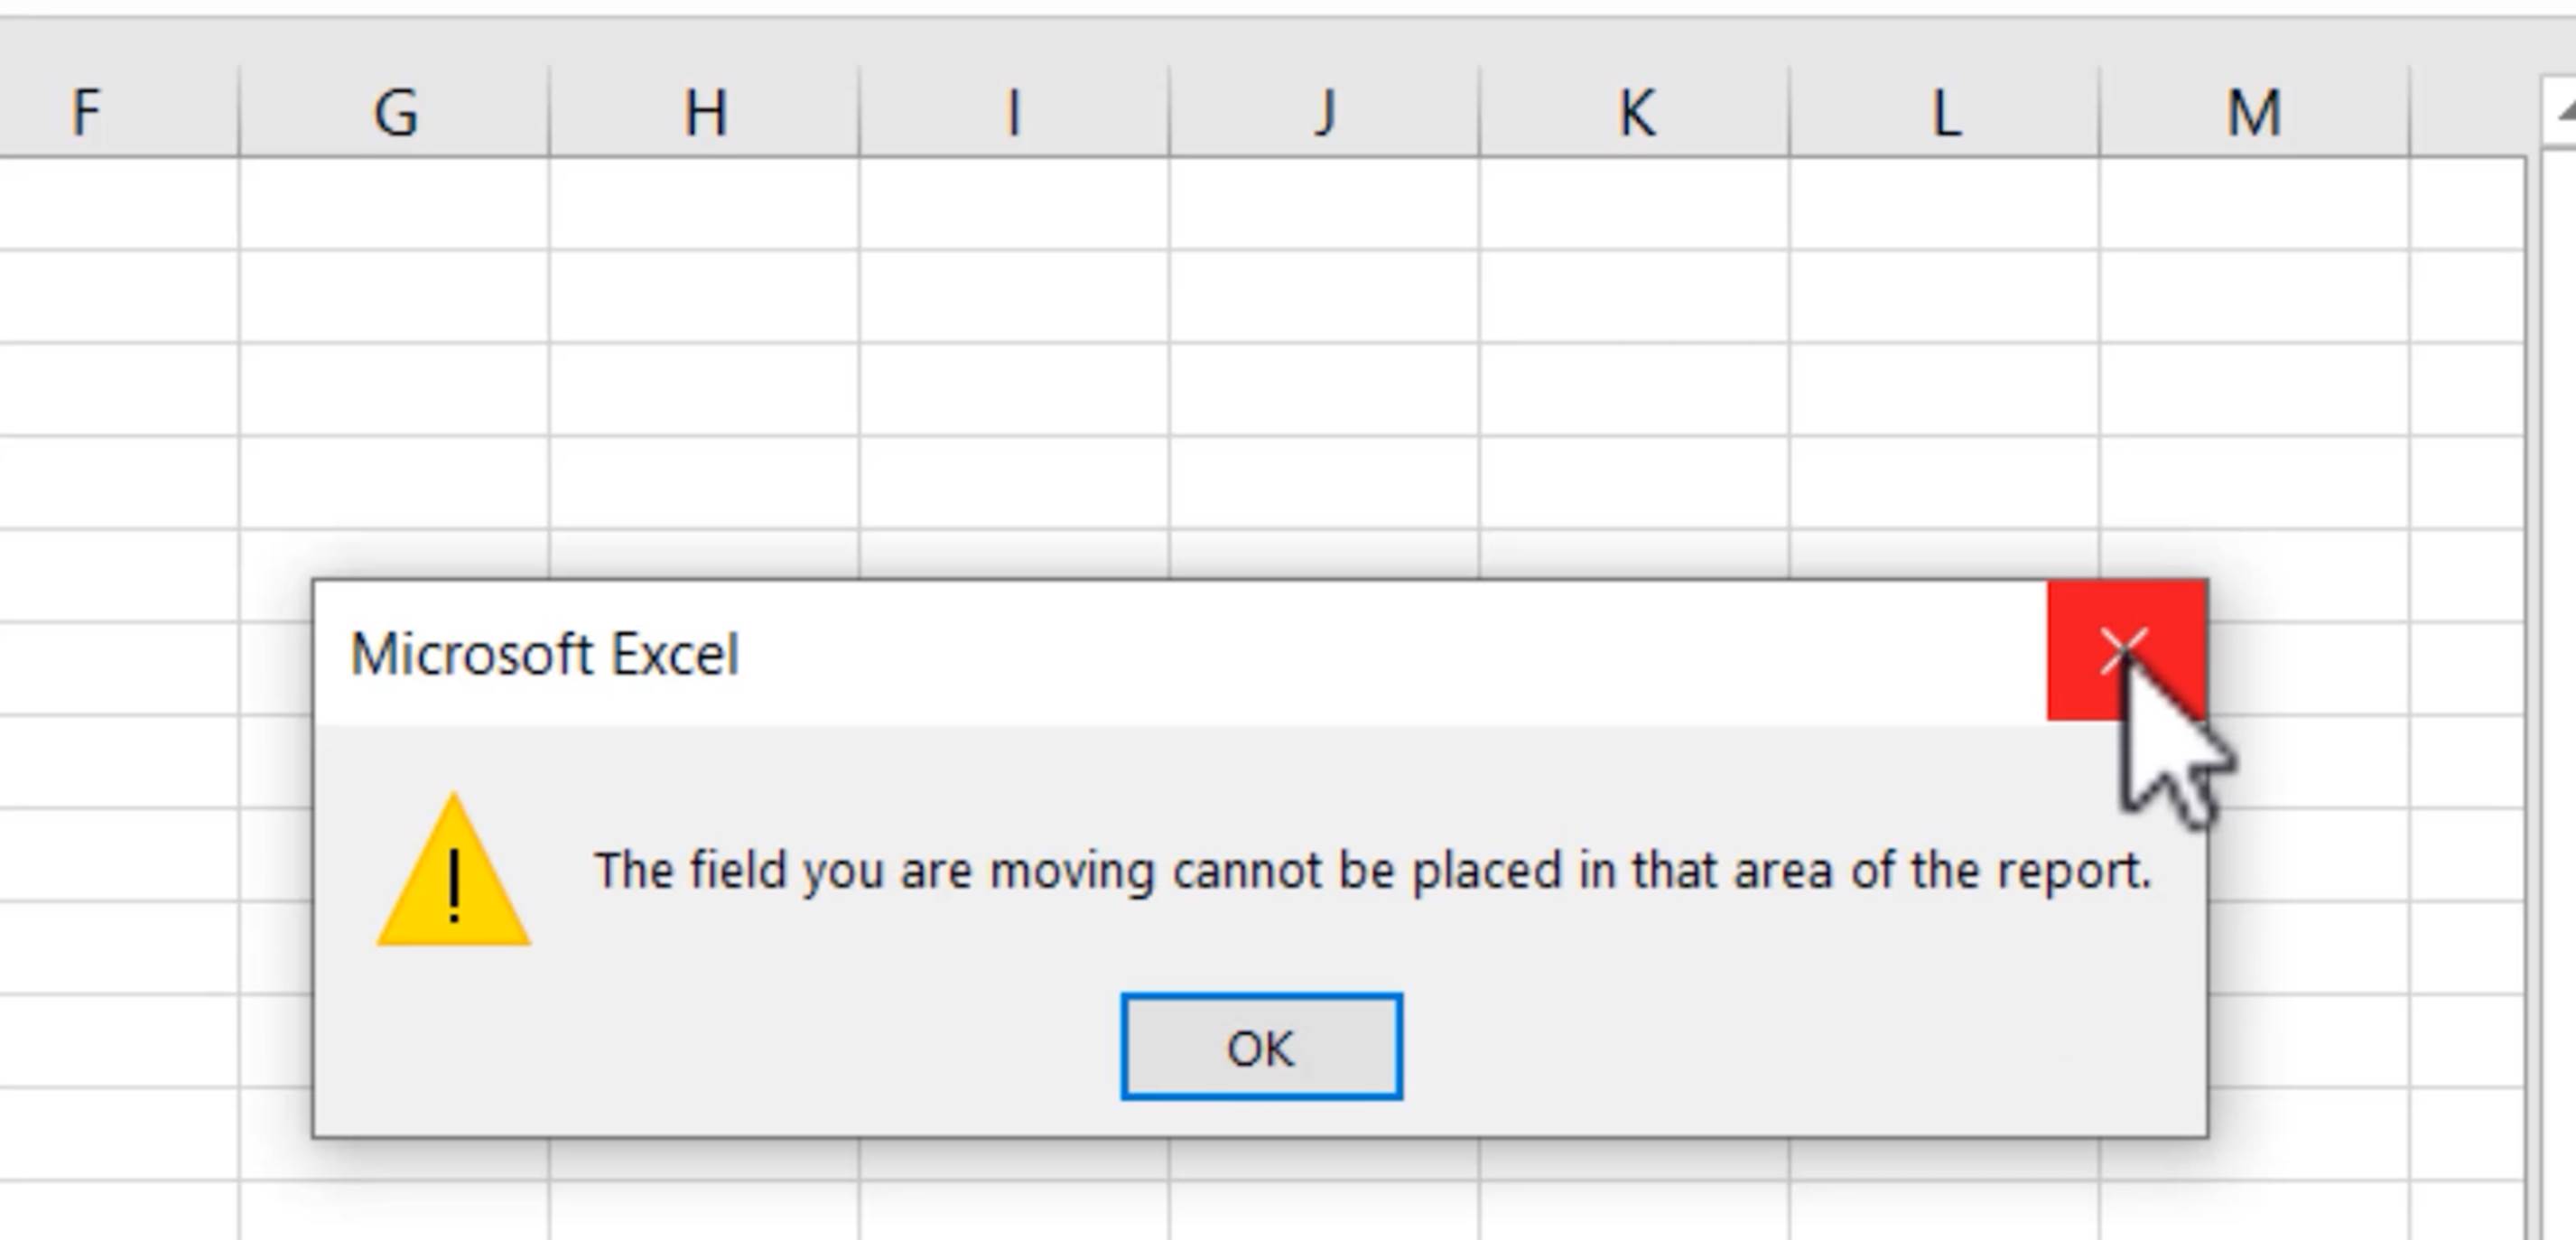
An error is generated whenever you attempt to do this informing you that “The field you are moving cannot be placed in that area of the report”.
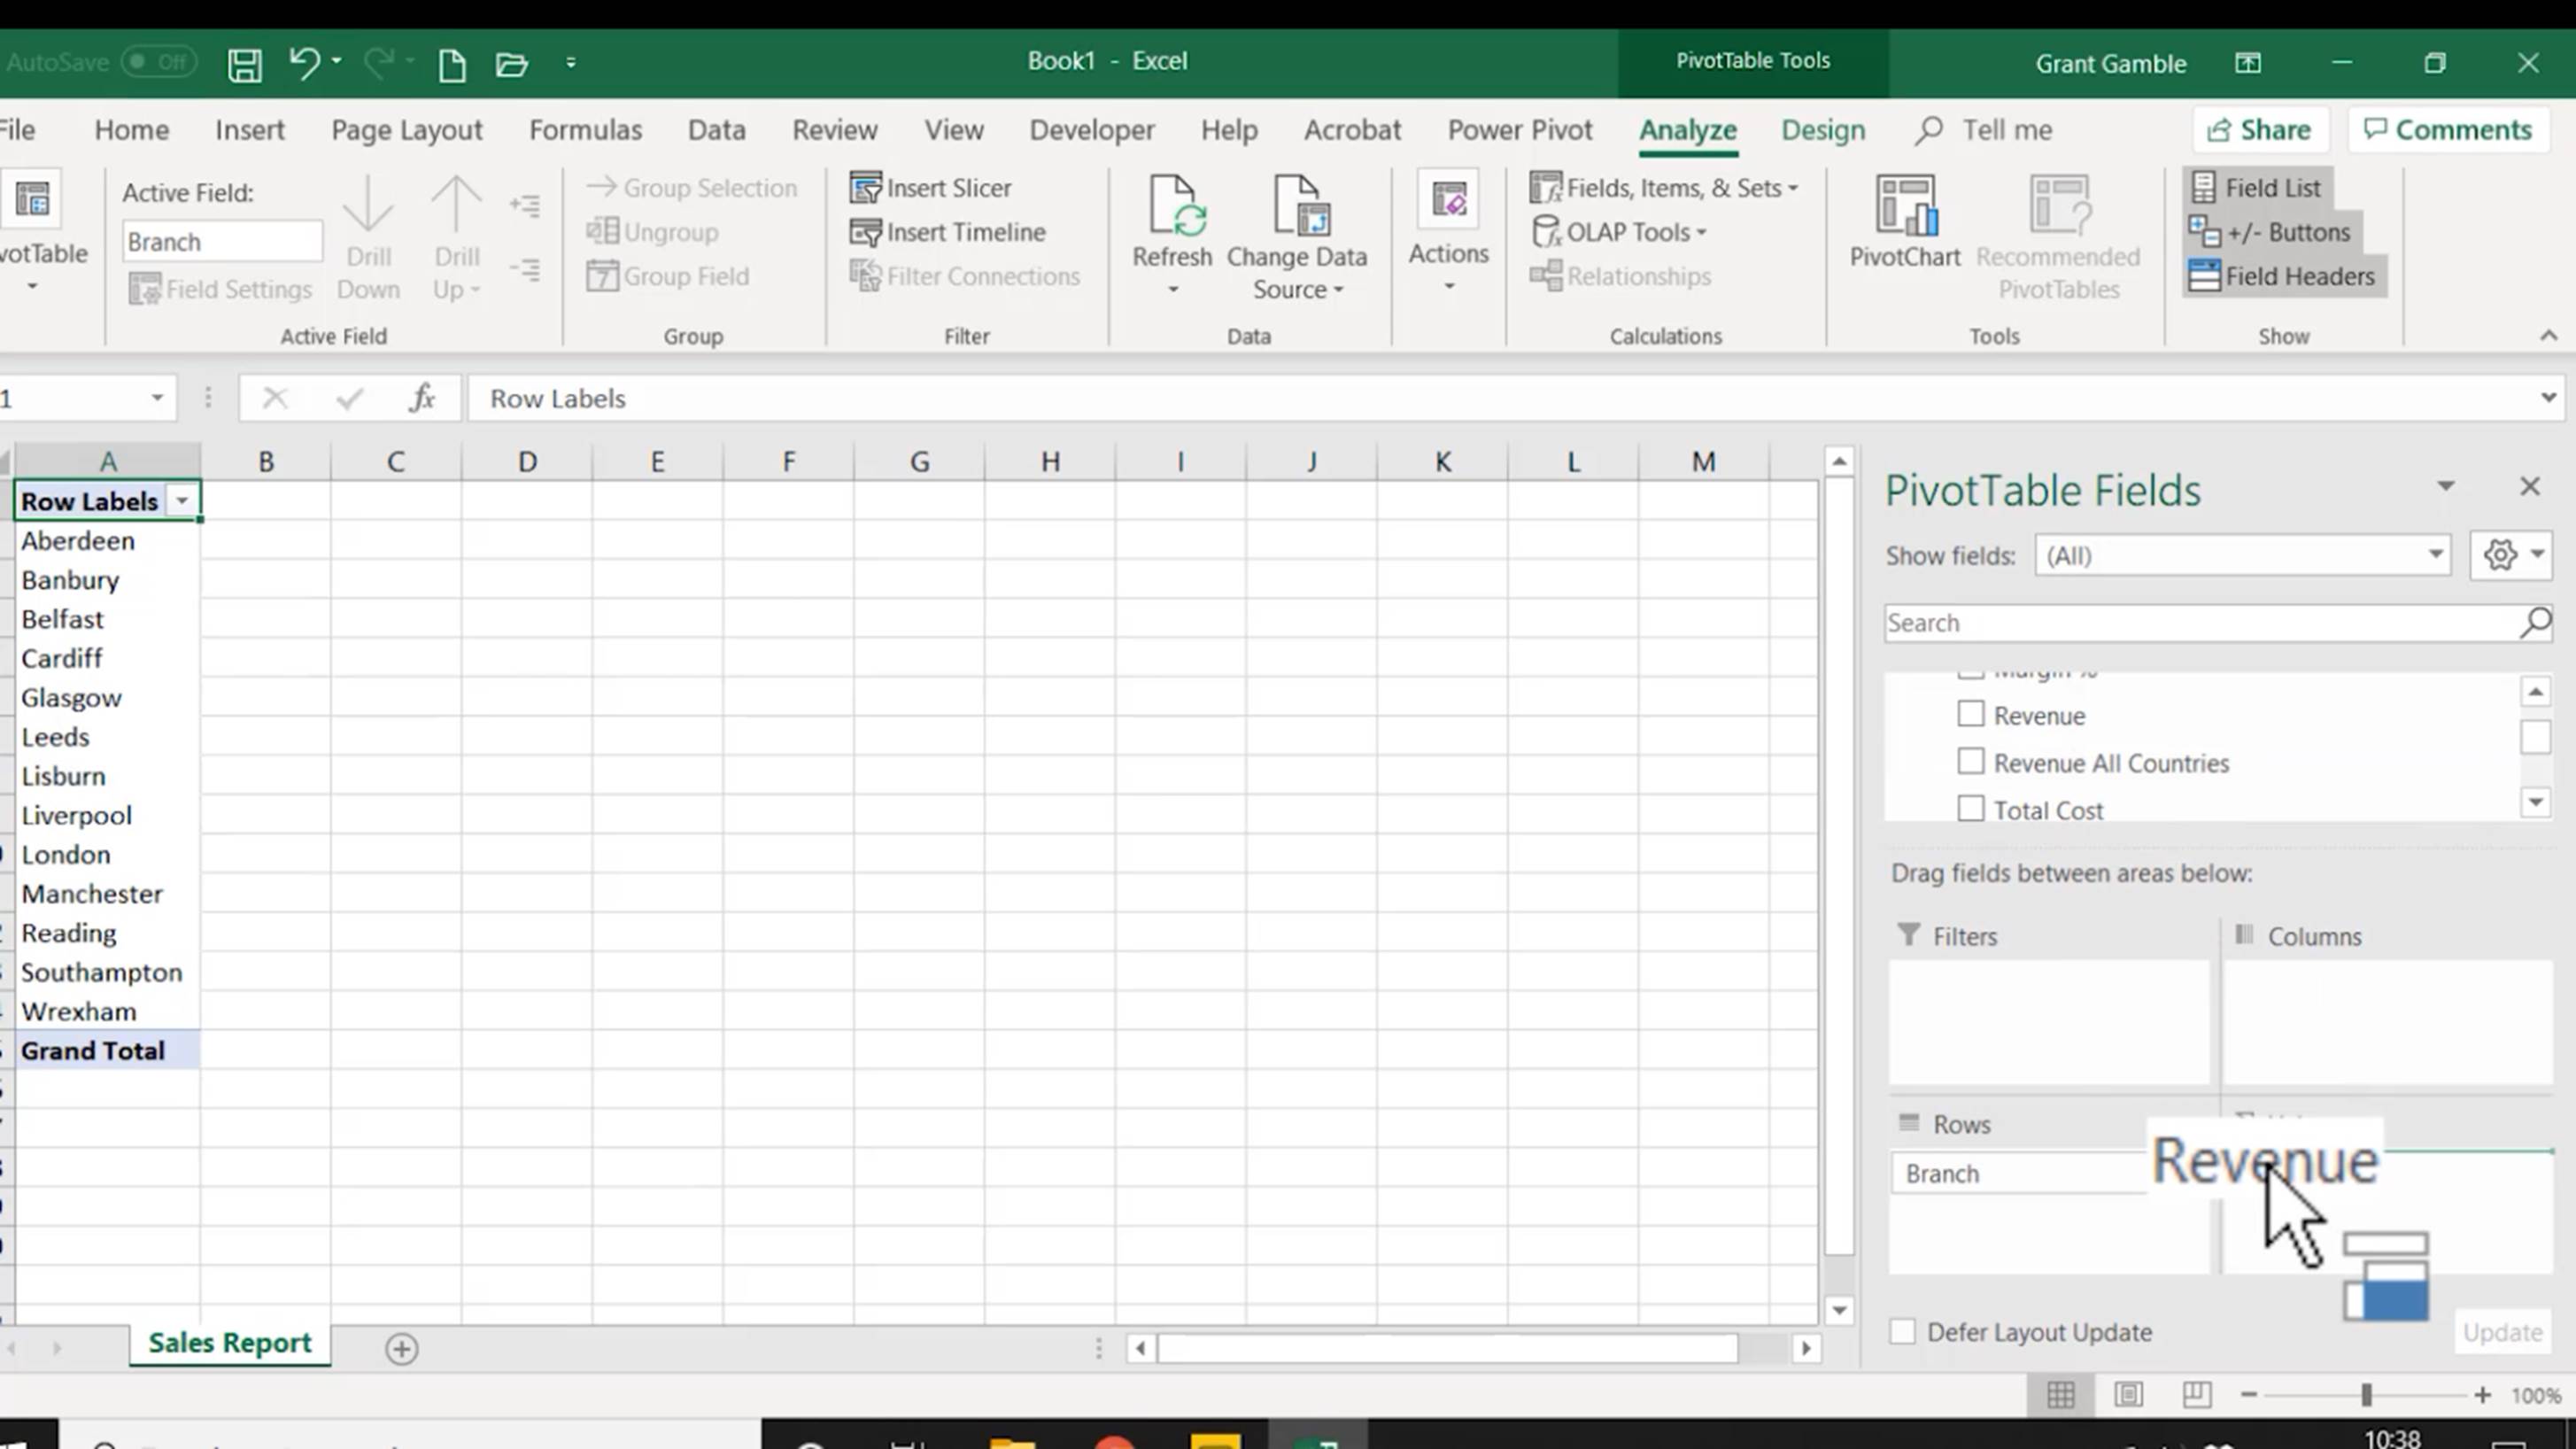
Therefore, if you want your users to be able to use the “Analyze in Excel” feature effectively, you need to ensure that you create all the measures that they will need to build their reports. (Thus, we cannot drag a Revenue column to the values area of a pivot table, but we can drag a Revenue measure.)
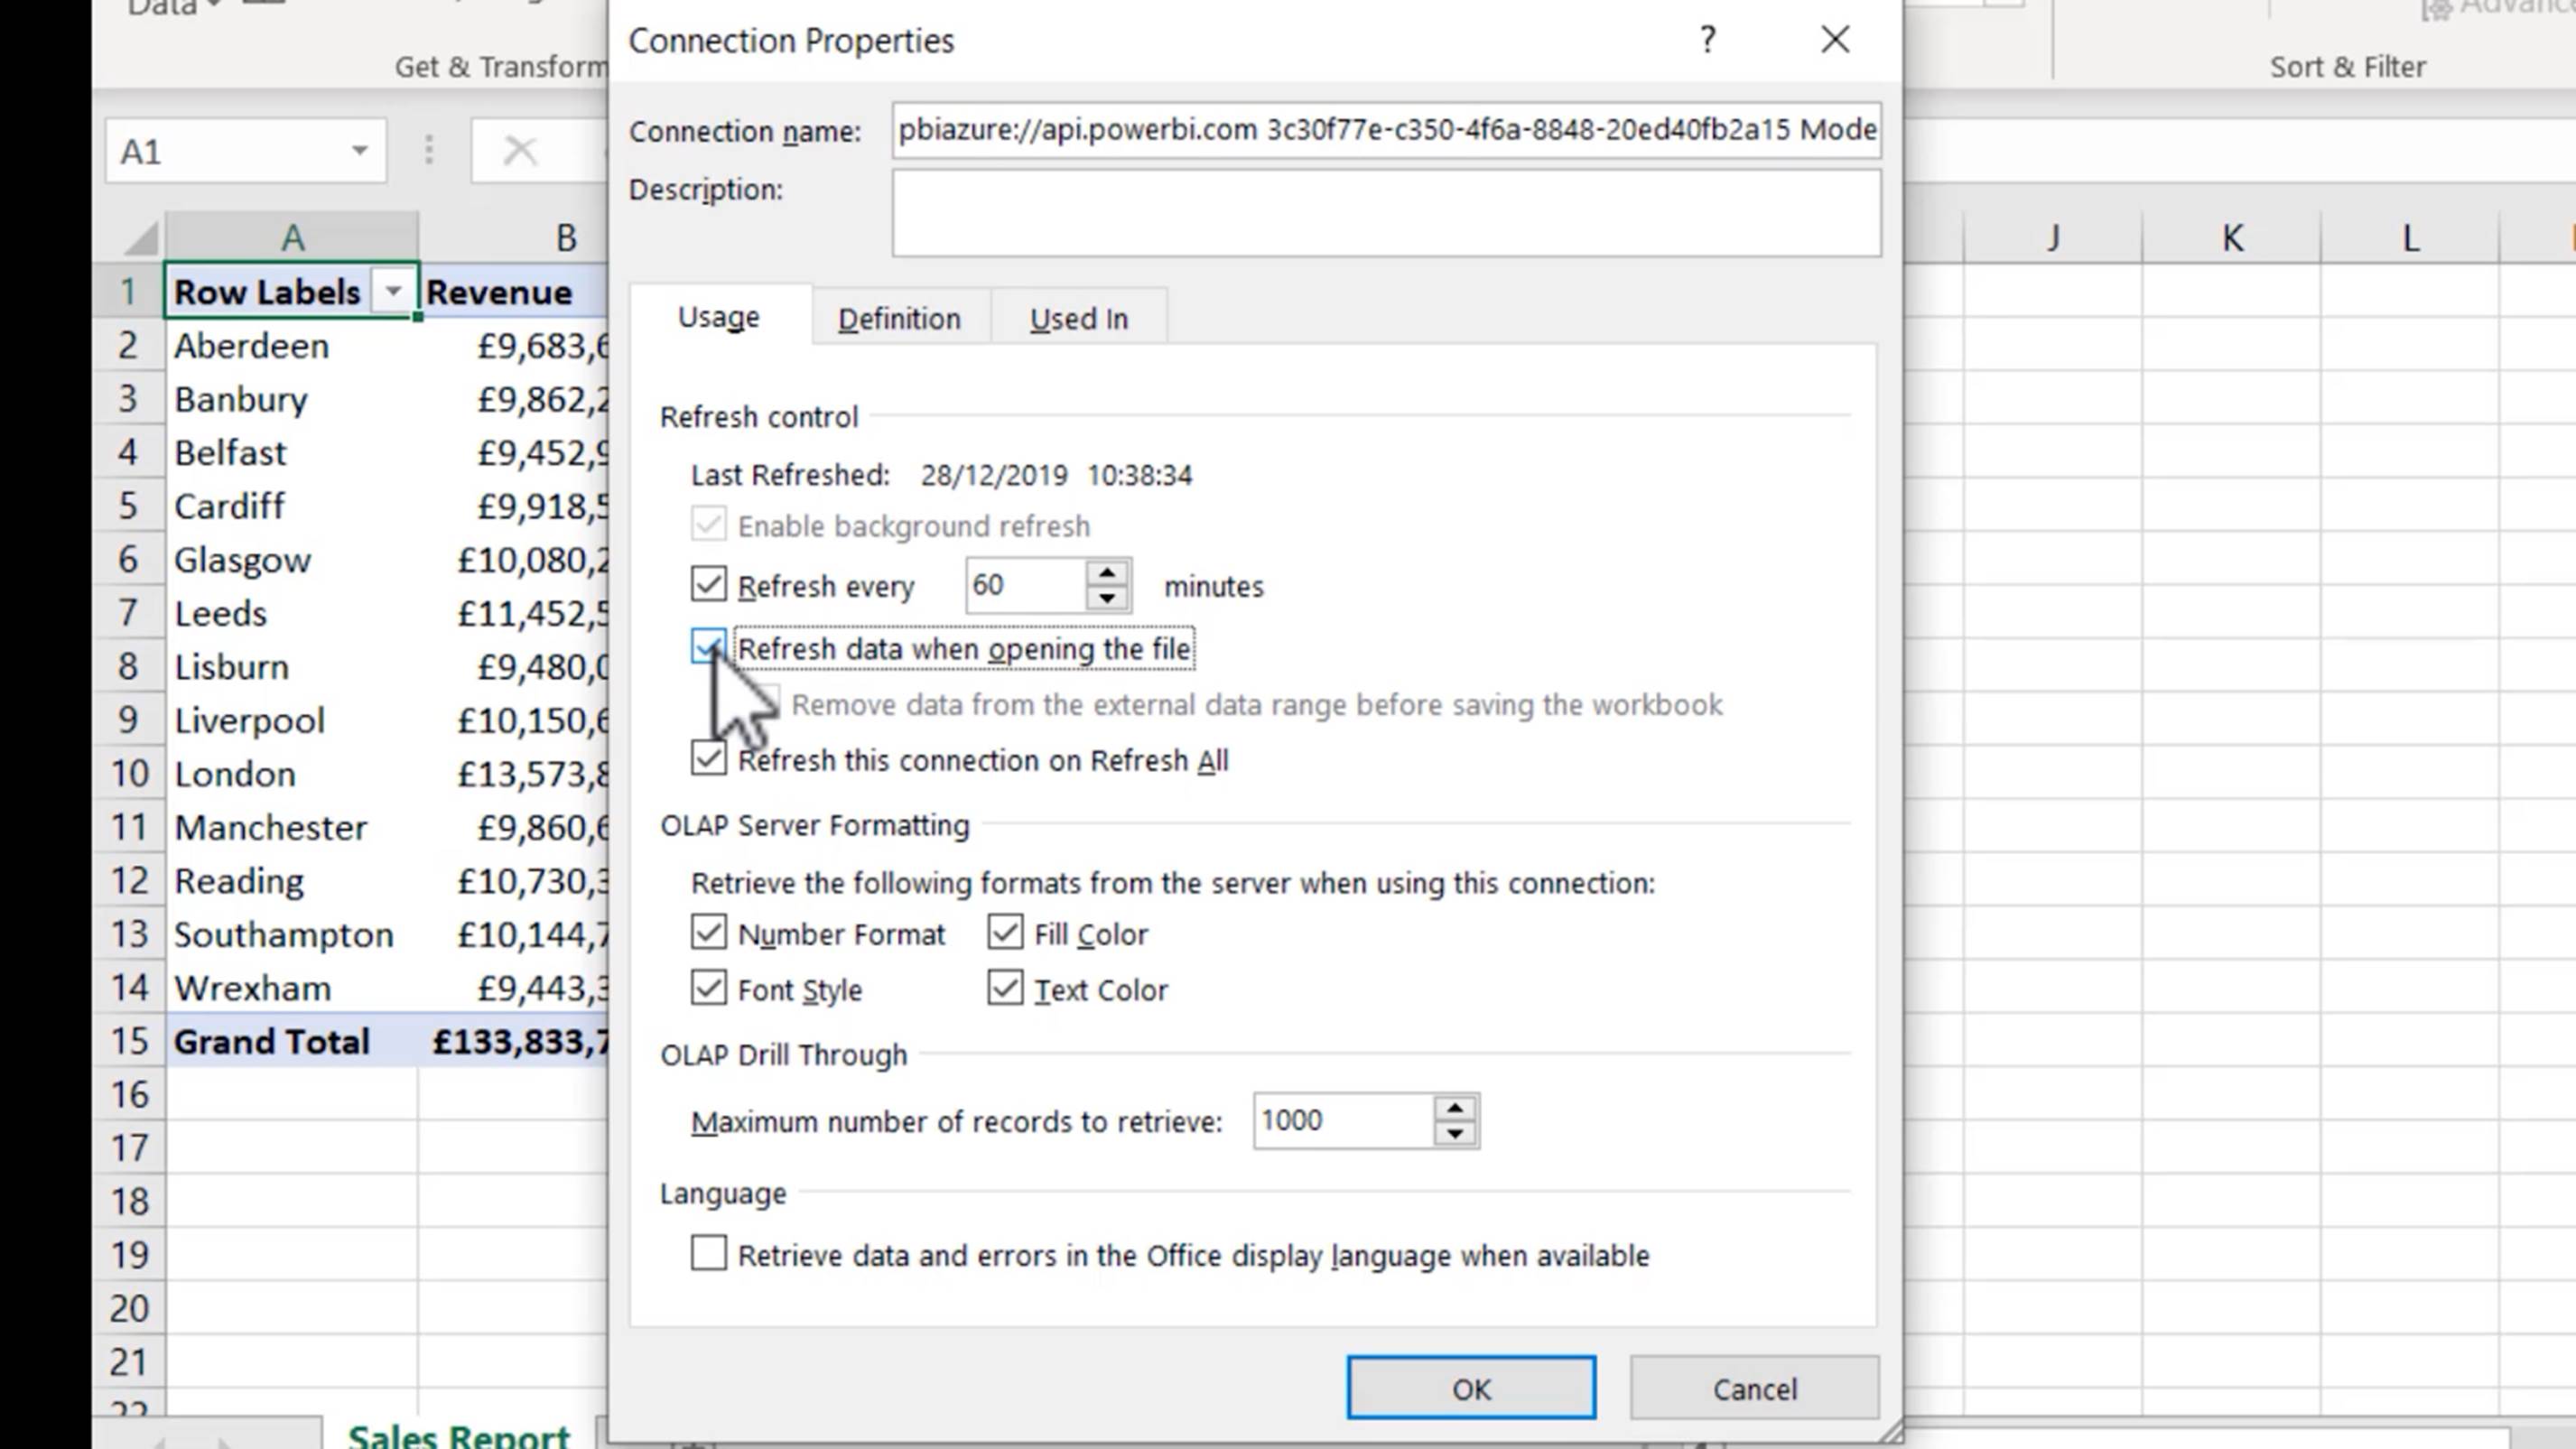
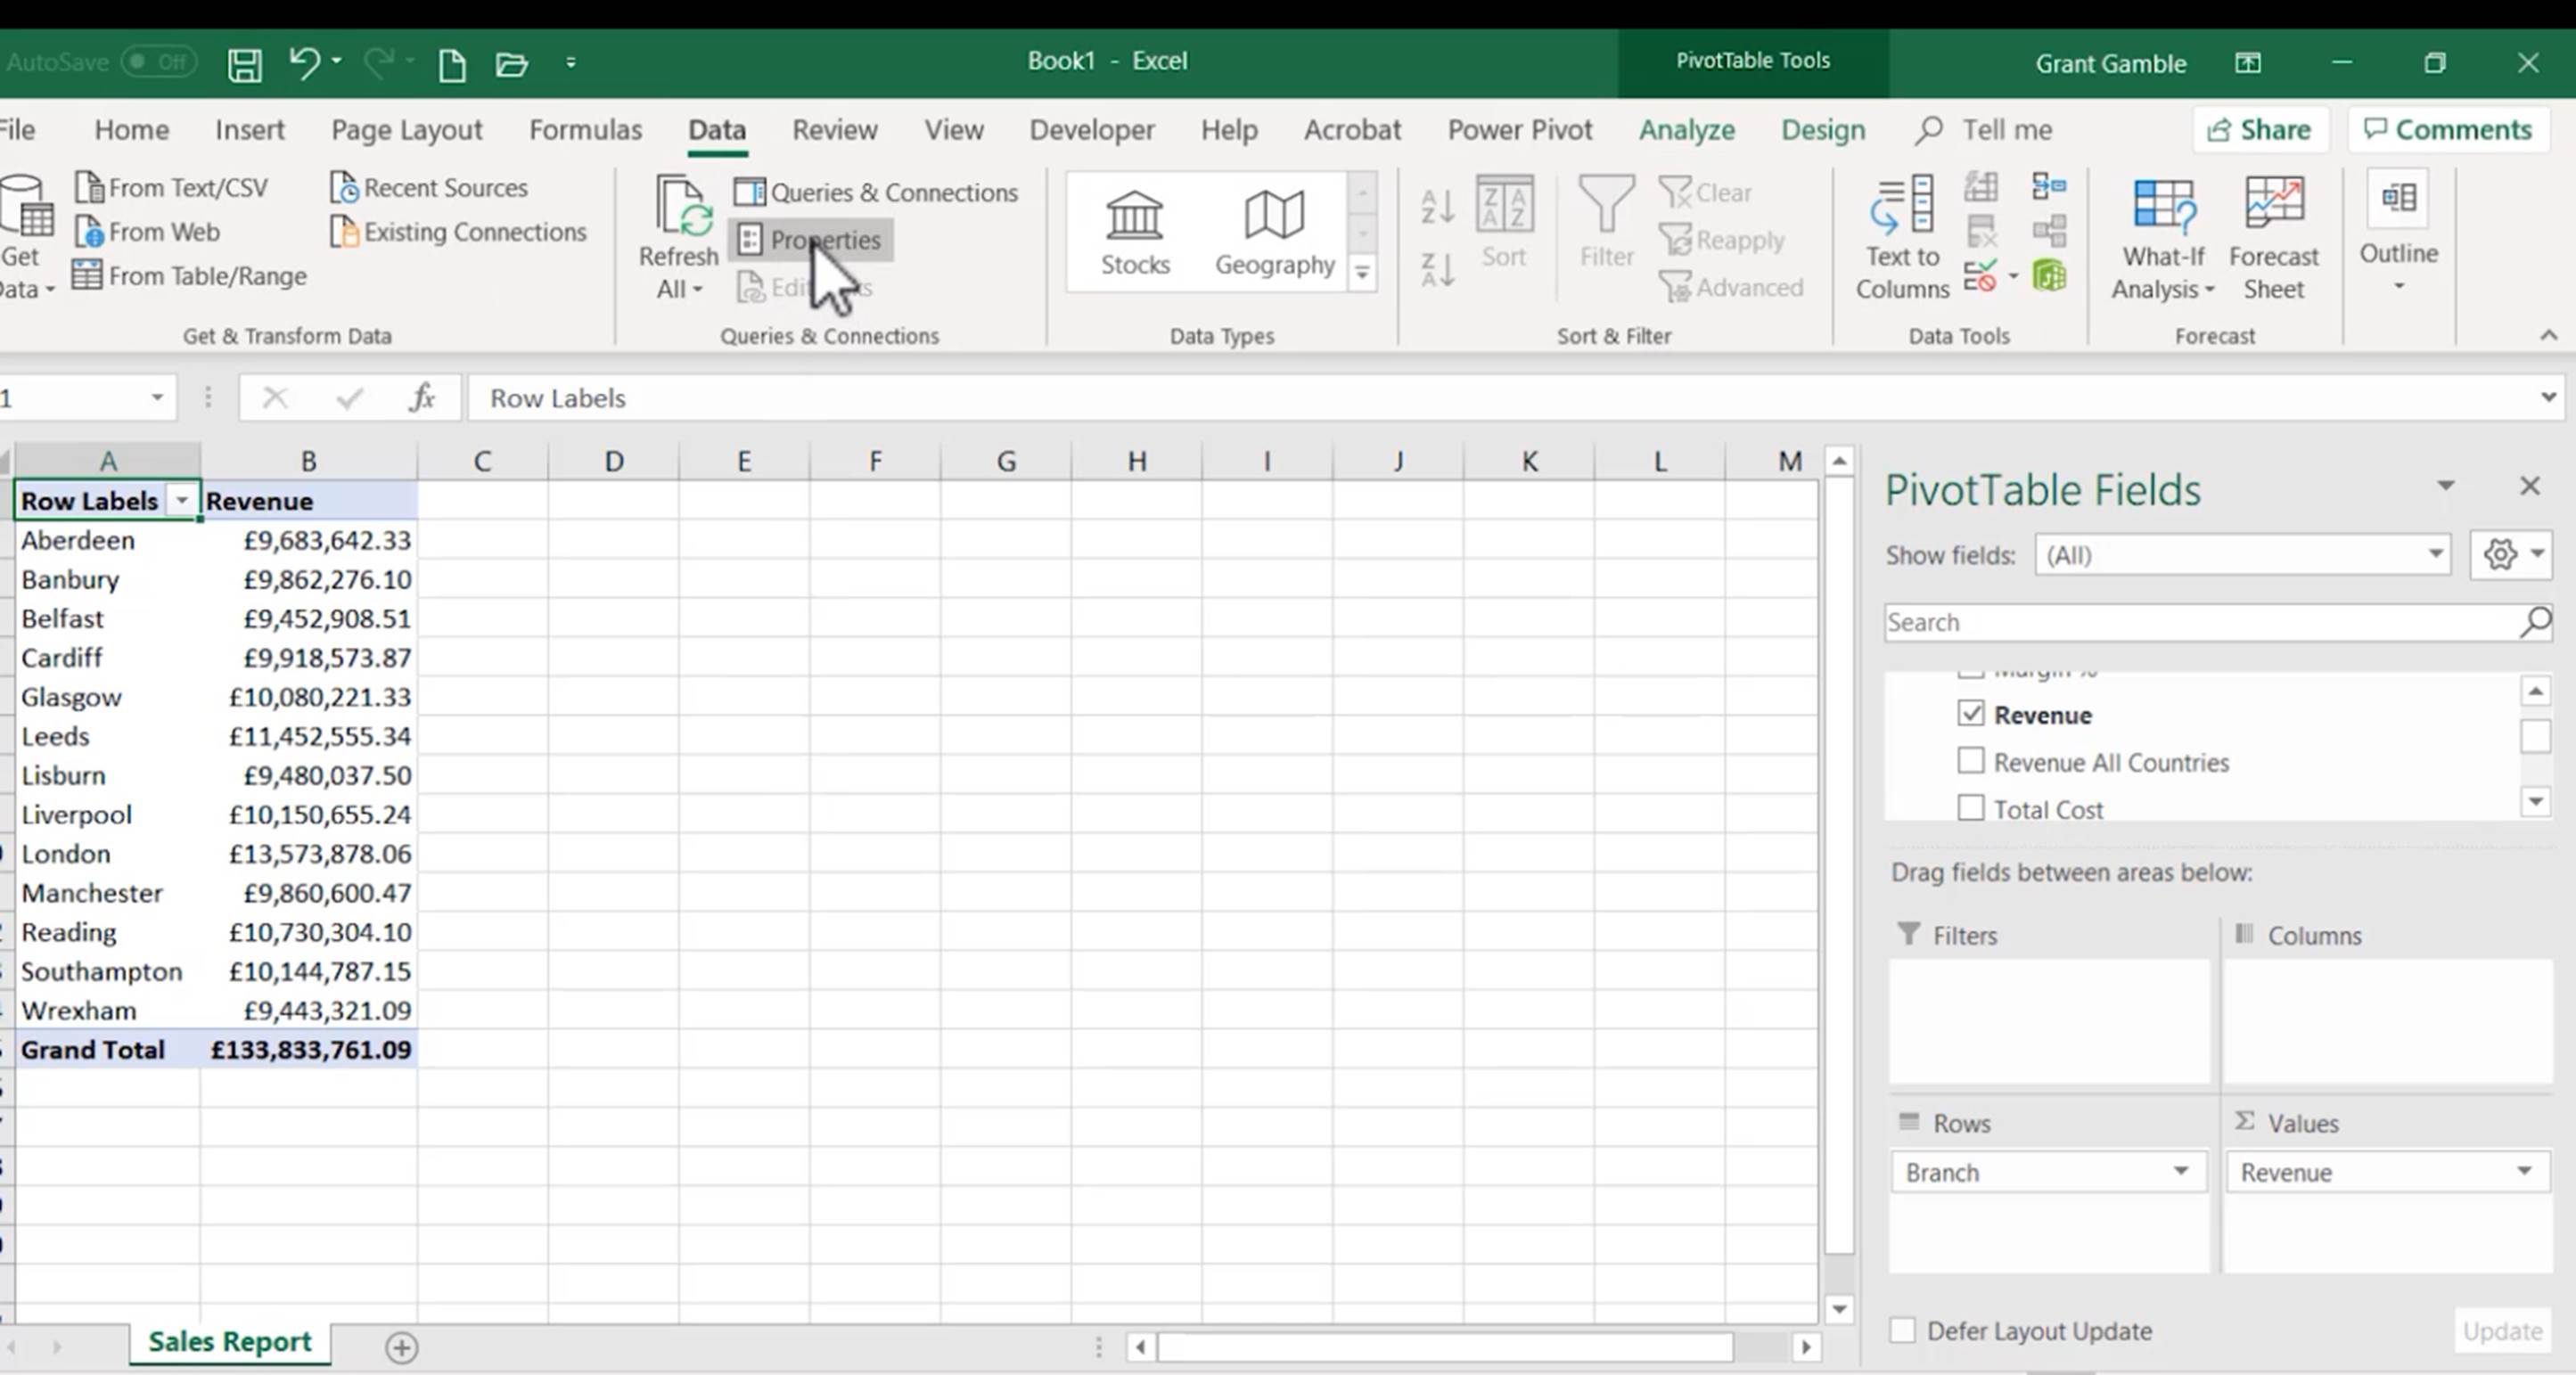
To access the refresh options for the dataset, click Data > Properties.
In the Connection properties, you have the option to set up a scheduled refresh “every N minutes”. You can also have the dataset automatically refresh every time the file is opened.