- You are here:
- Home »
- Blog »
- Power BI »
- Power BI DA-100 Exam Tips
Manage Datasets
Identify Downstream Dataset Dependencies

Power BI DA-100 Exam Tips
Manage Datasets
Identify Downstream Dataset Dependencies
In this series of blog posts, we will be examining some of the key features of Power BI Desktop, Power Query and the Power BI Service needed to pass exam DA-100: Analyzing Data with Microsoft Power BI.
In this Power BI training post, we will examine DA-100 exam – Manage Datasets: Identify Downstream Dataset Dependencies.
Identify Downstream Dataset Dependencies
This topic refers to two related features which are found in the Power BI service: lineage view and impact analysis.
List View and Lineage View
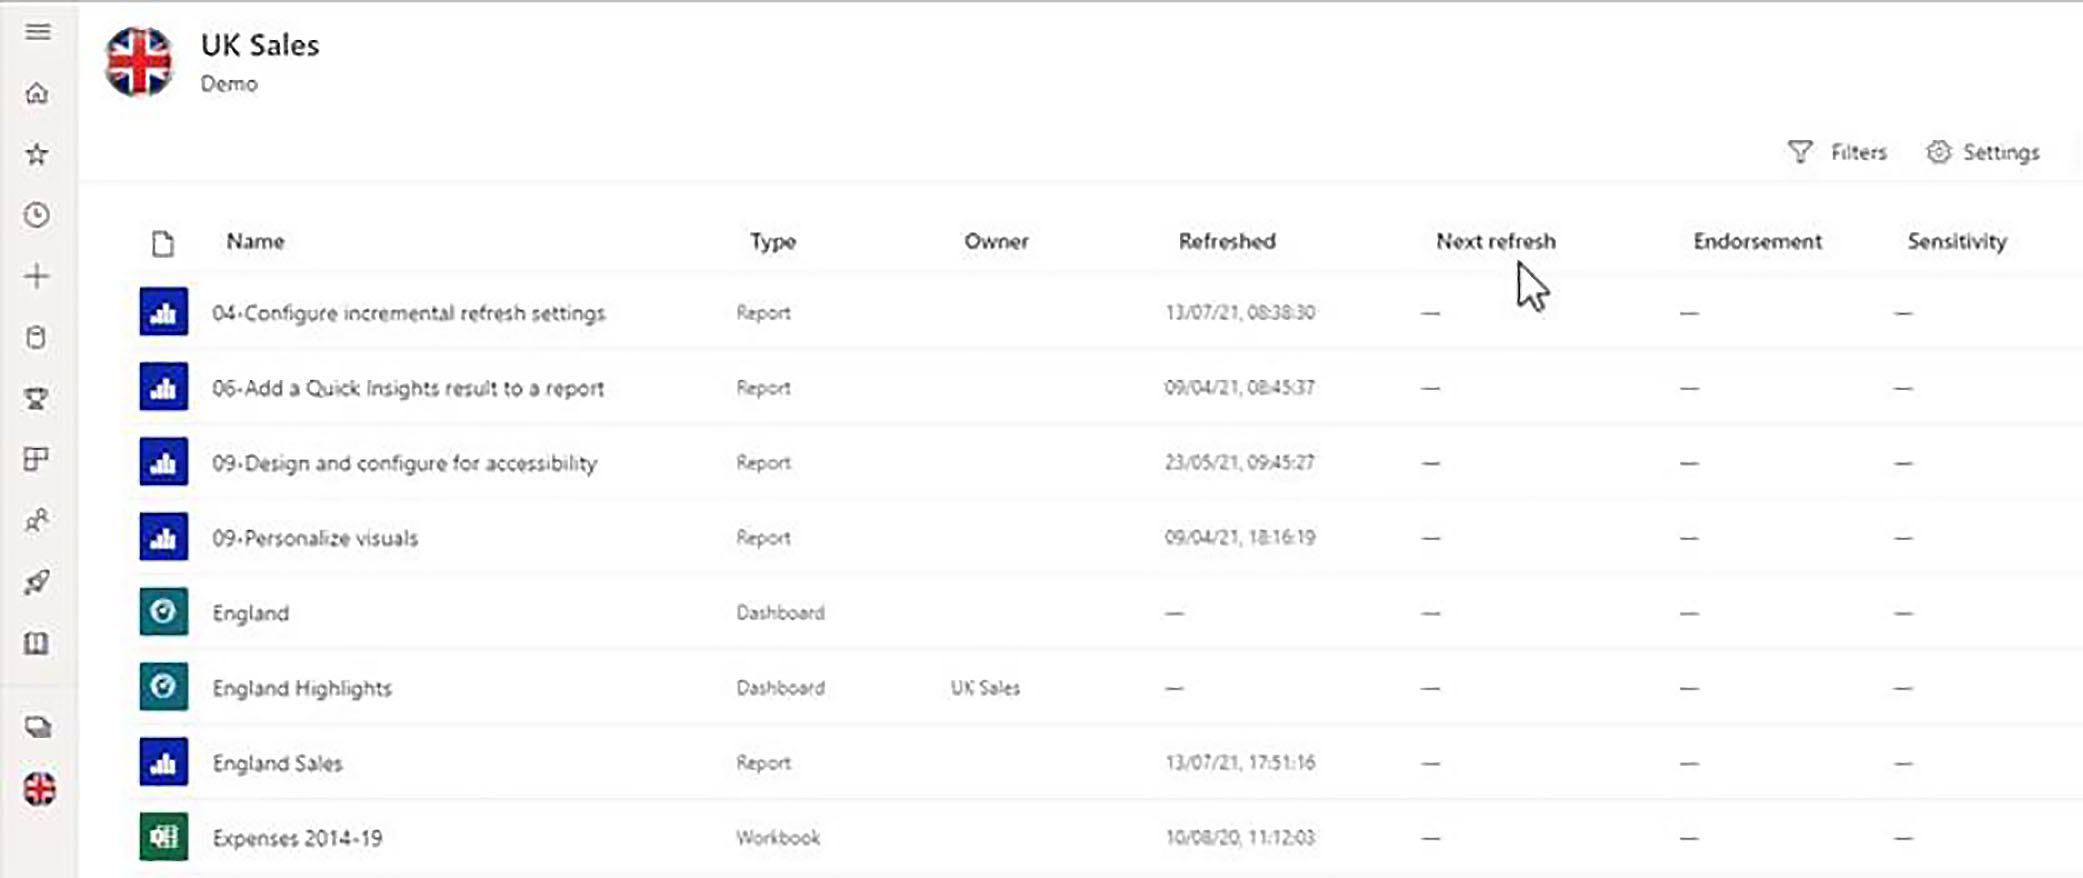
In the Power BI service, when you are looking at the contents of any workspace, the normal view, the flat view if you like, is List View. Here, you see the name of each item, and you have a series of columns, which give you further information about each item.
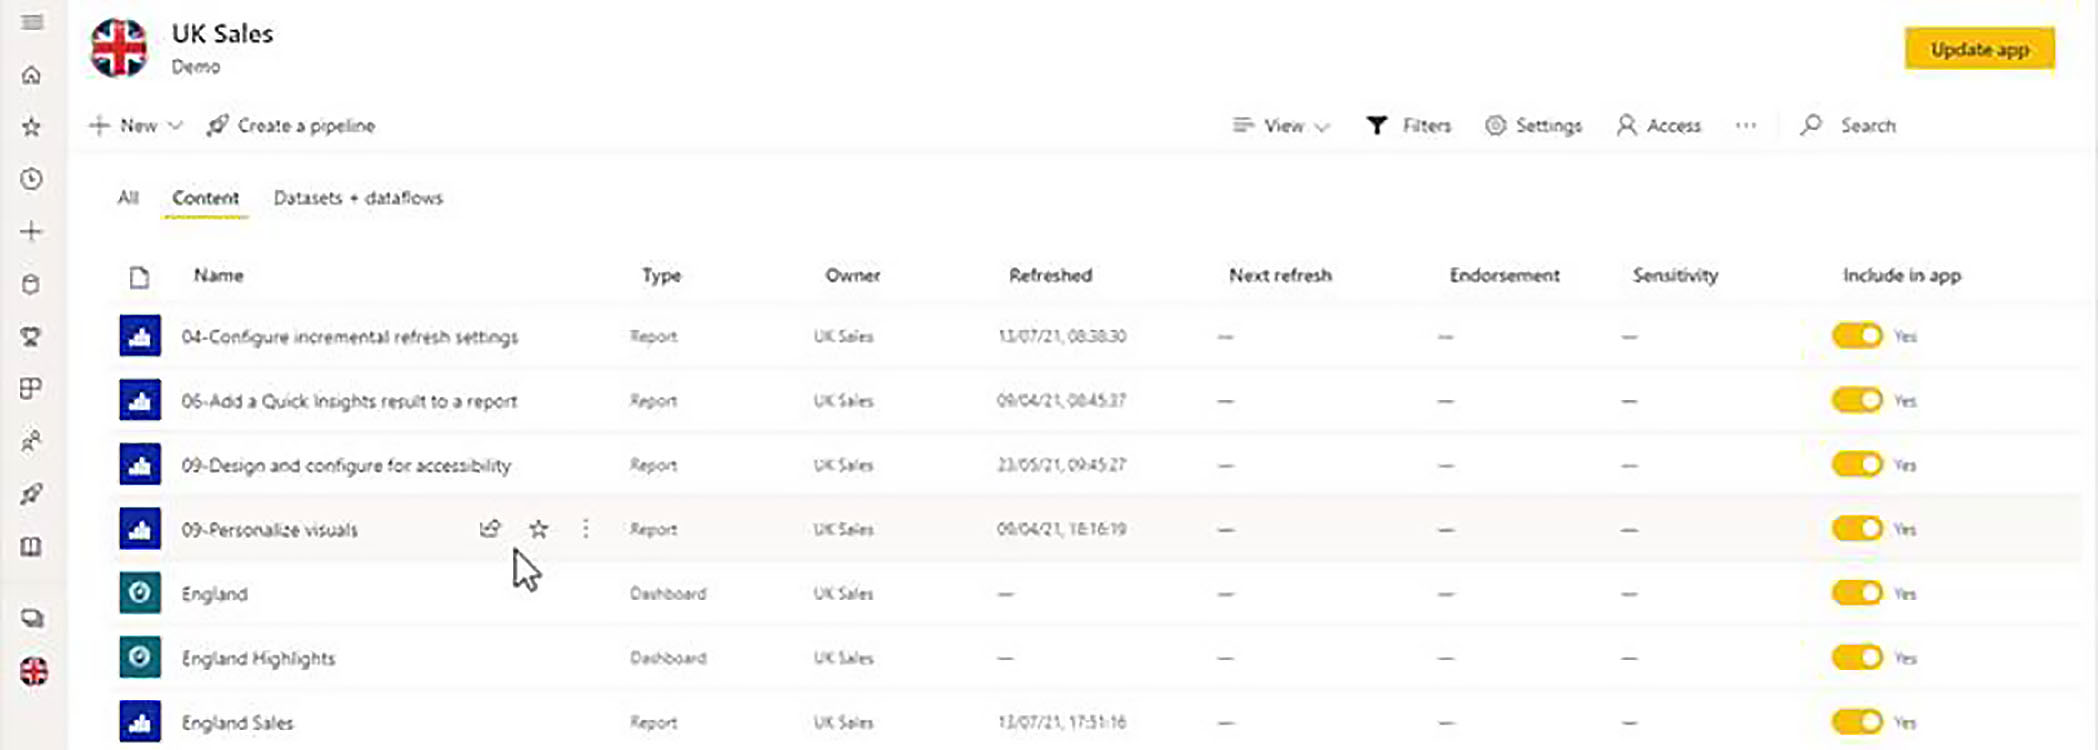
However, what this view does not give us is any idea of the relationship between the various items, the various artefacts within the workspace. Within the workspace, we have datasets; we build reports from those datasets; and then, typically, we create dashboards, which also have dependencies on those reports.
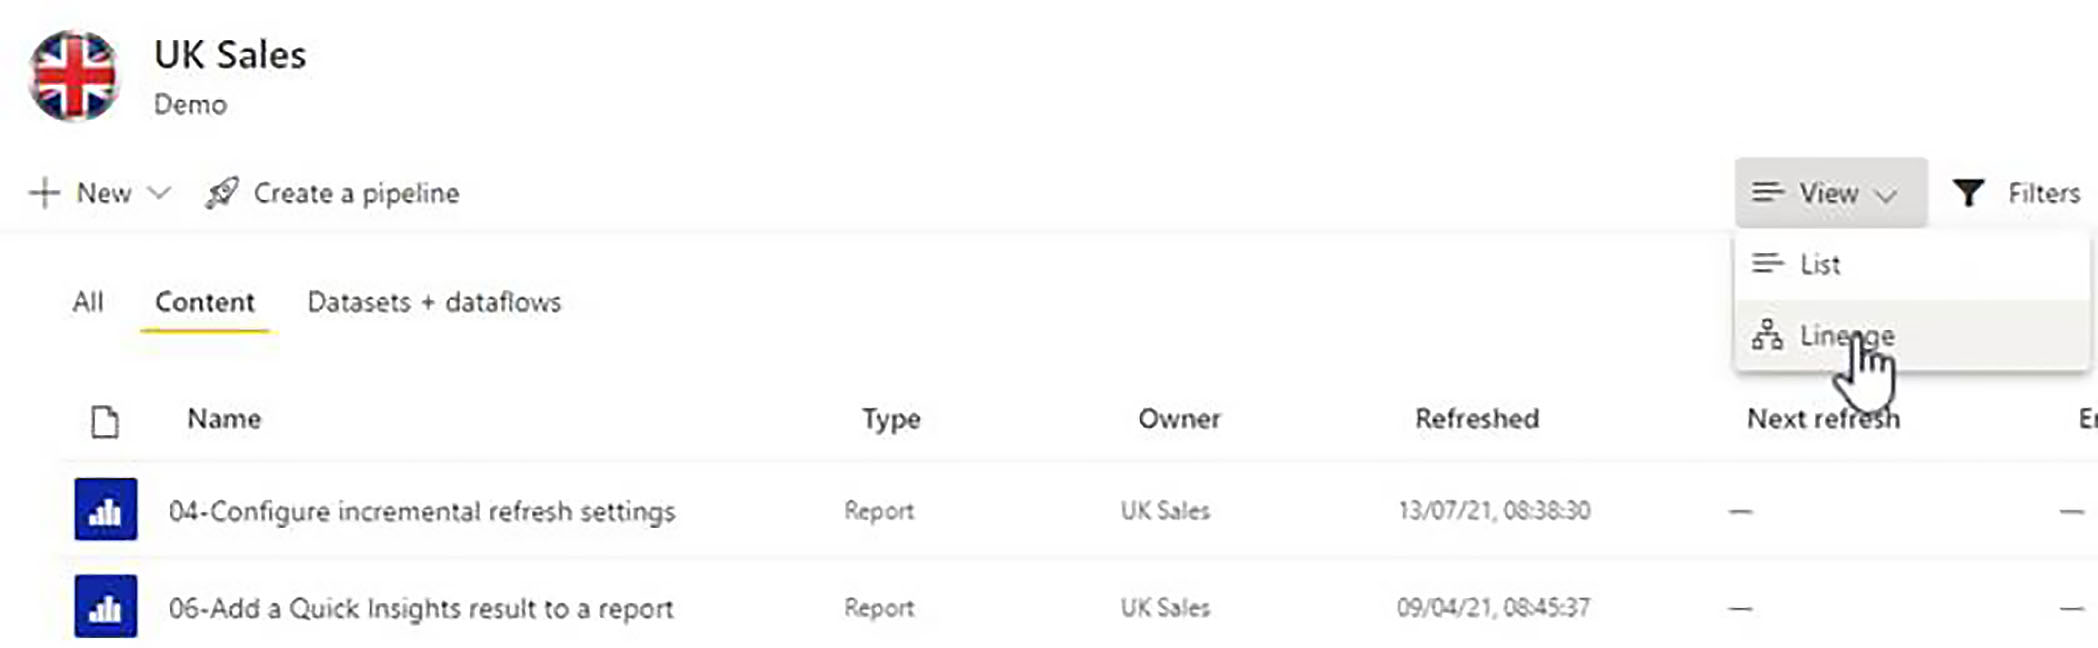
In order to keep track of these dependencies, and to get a good idea of the impact that any changes you might make, will have on other related items, this is where switching to lineage view becomes useful. To do that, we just choose lineage from the view drop-down menu.
Lineage View and Workspace Roles
In order to work in lineage view, you need to have write access to the workspace in question, and this means that of the four roles available for access, you need to have Admin, Member, or Contributor access.
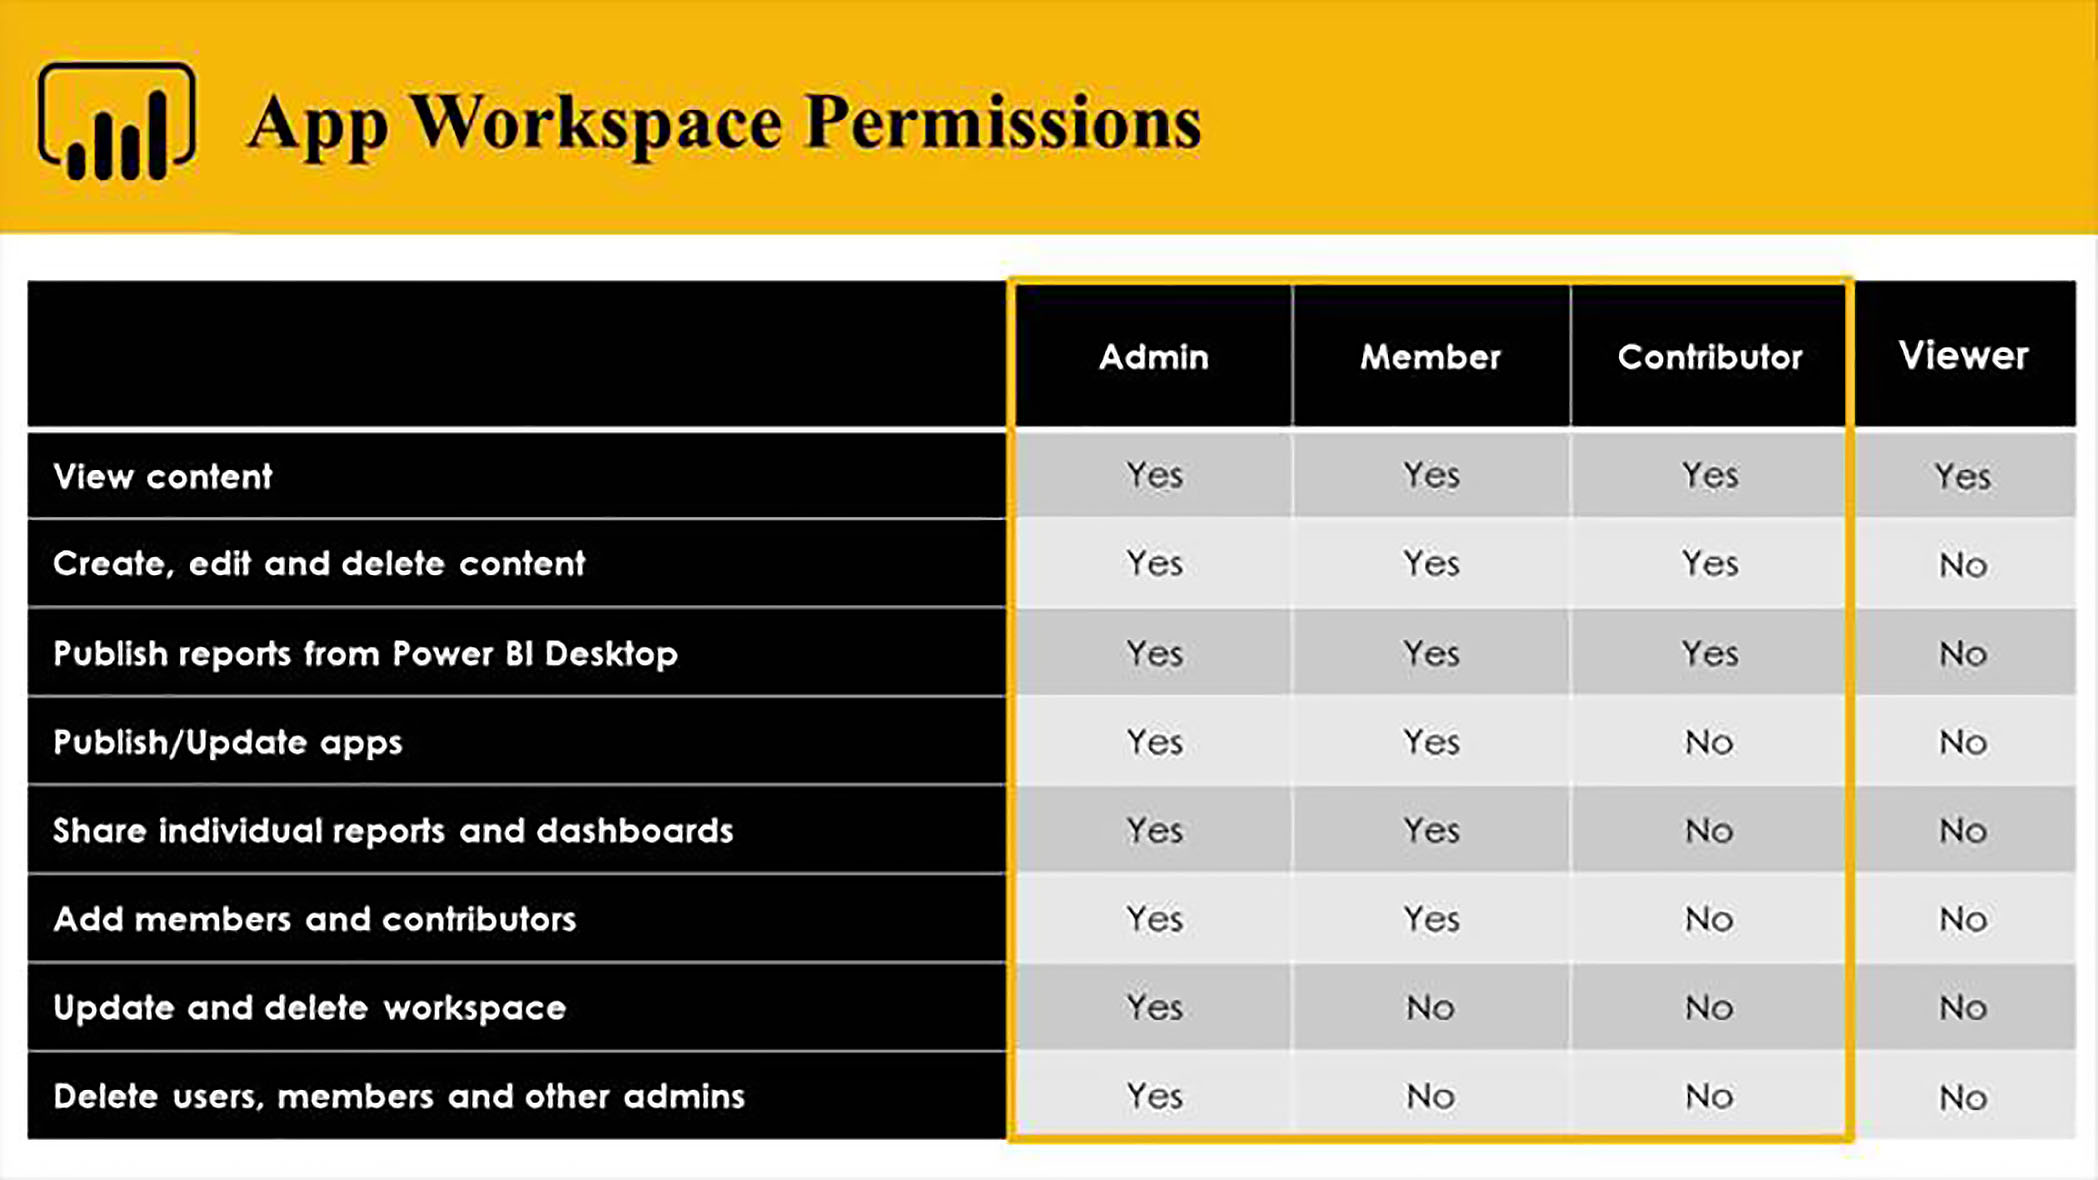
Here is the same workspace as seen by someone who only has Viewer access to the workspace, and you will notice that there is no possibility of switching to lineage view.
This is because the Viewer role only gives you access to content, it does not give you access to the underlying datasets. So, lineage view would not really make any sense in that context.
Exploring Lineage View
In lineage view, content is shown in related clusters.
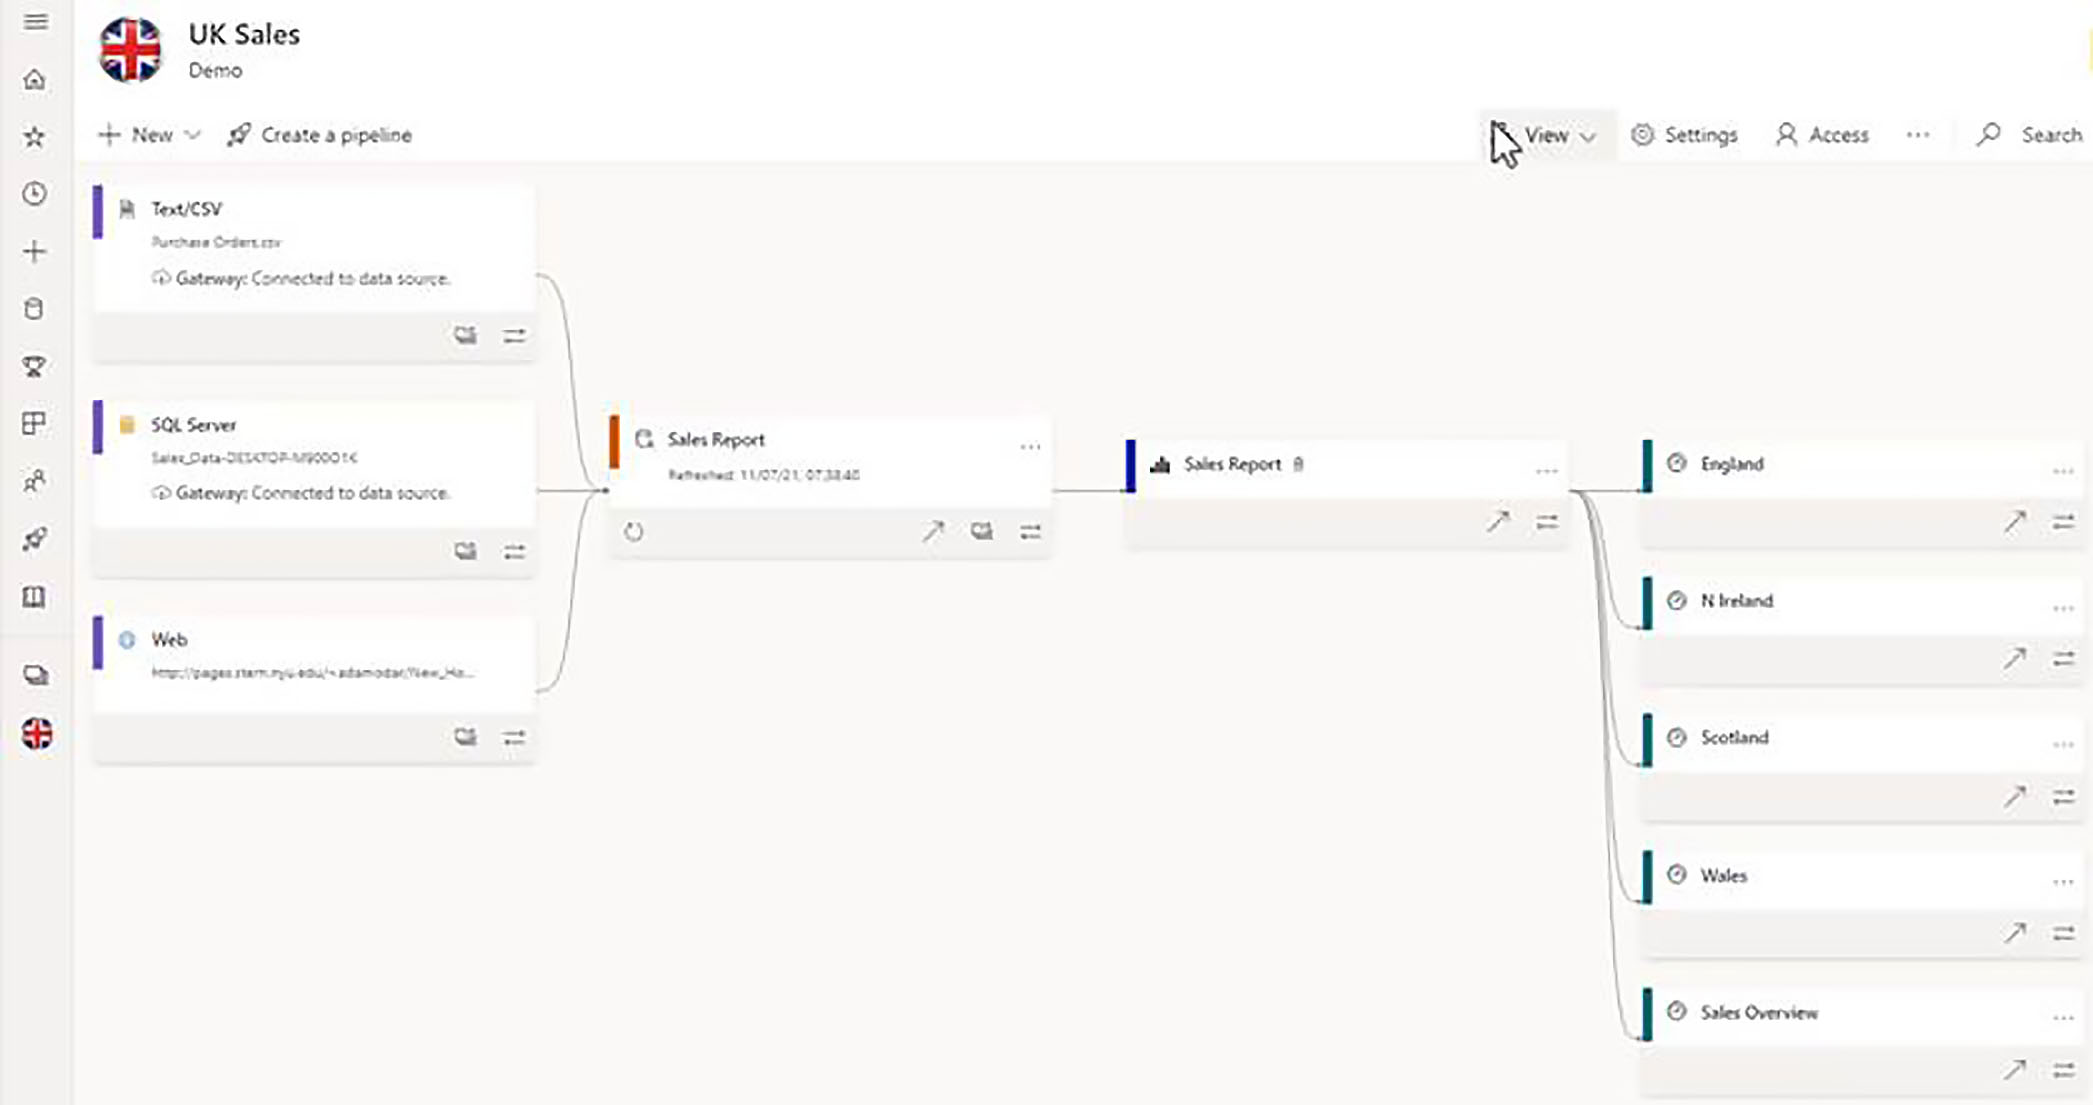
In this first cluster, we can see that we have a dataset, which is made up of three components, a CSV file, tables or views brought in from SQL Server, and then some data brought in from a web source.
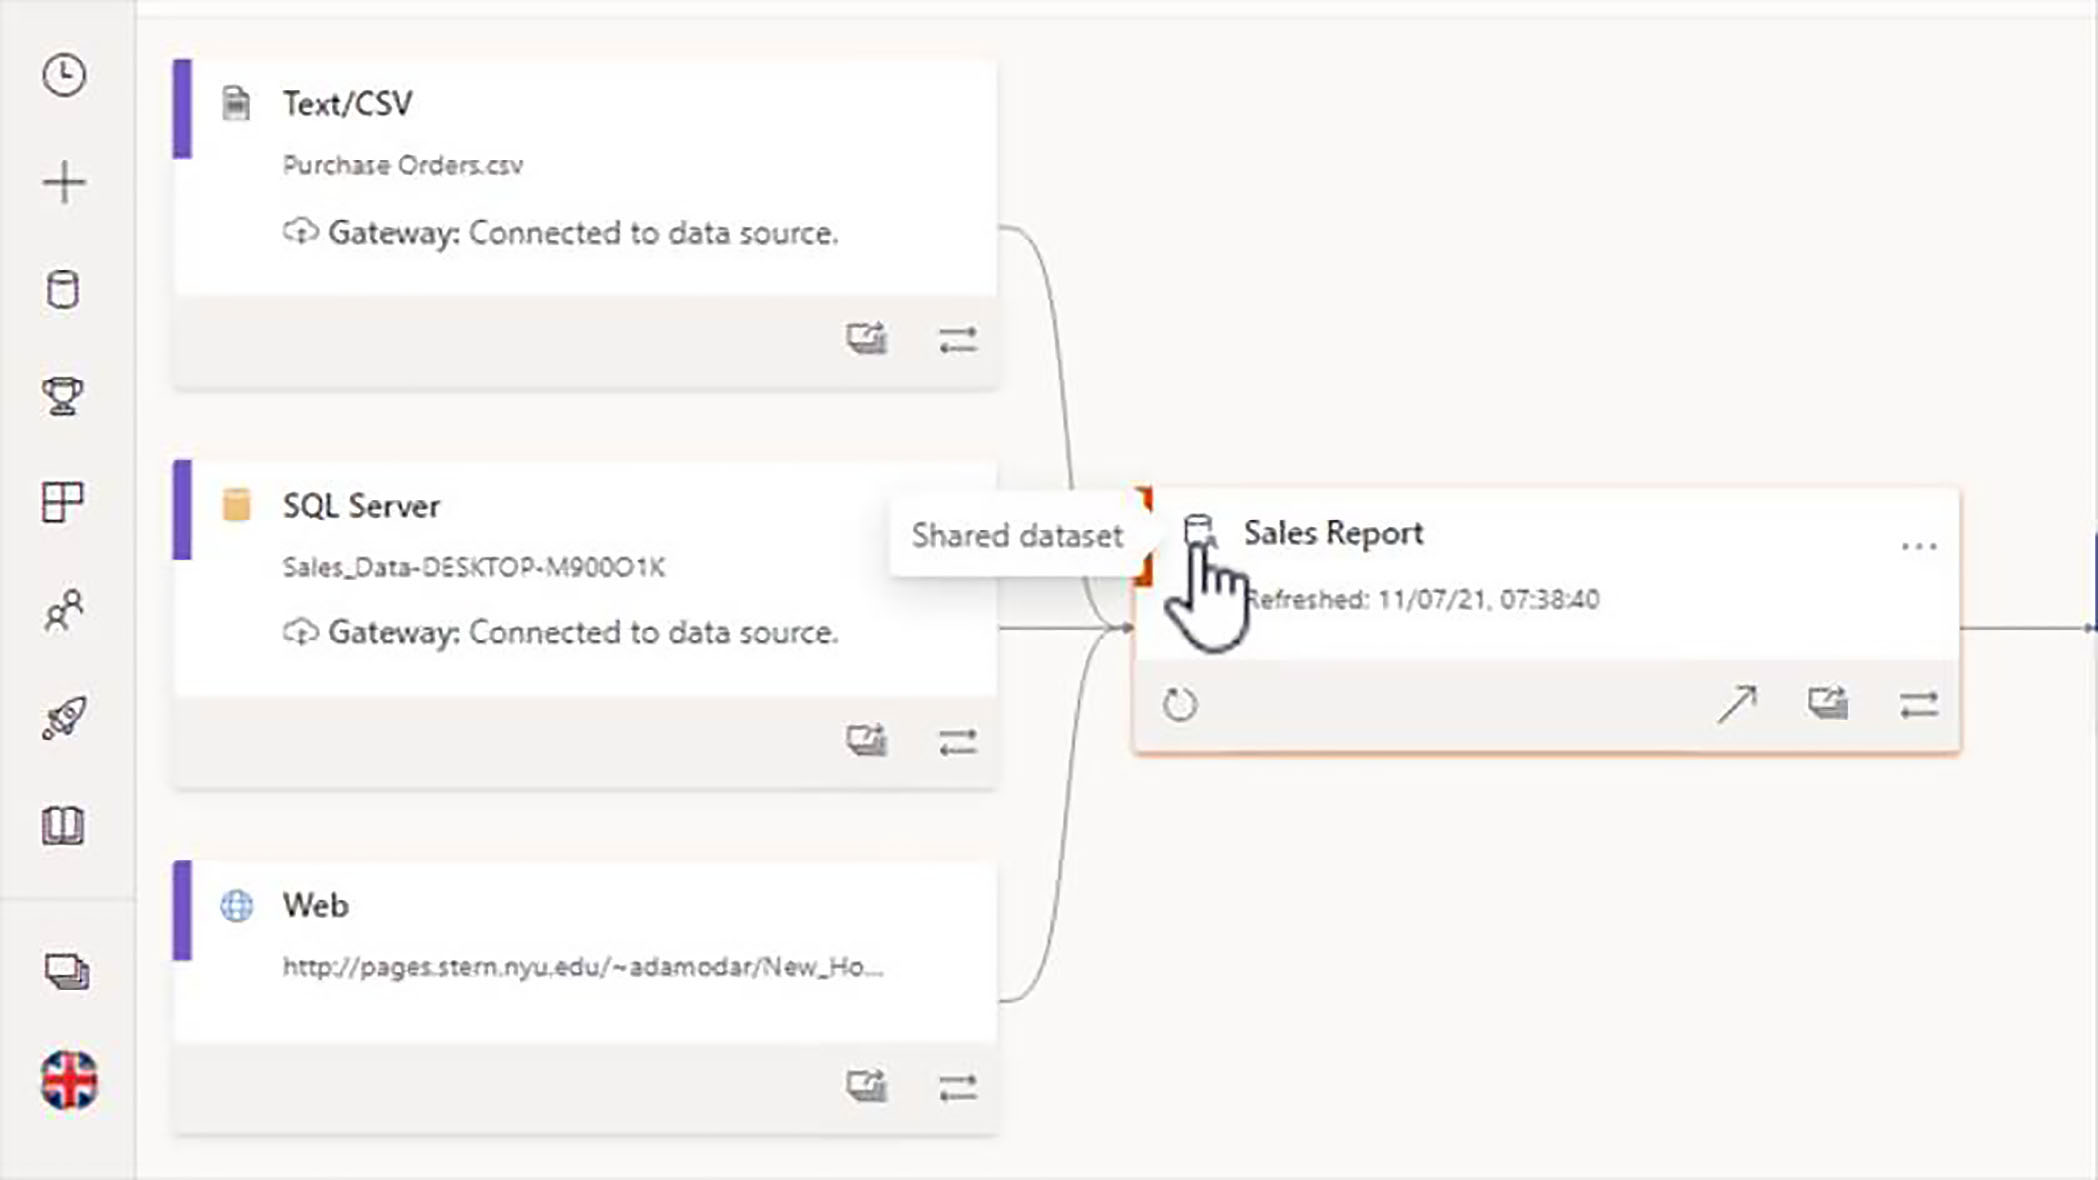
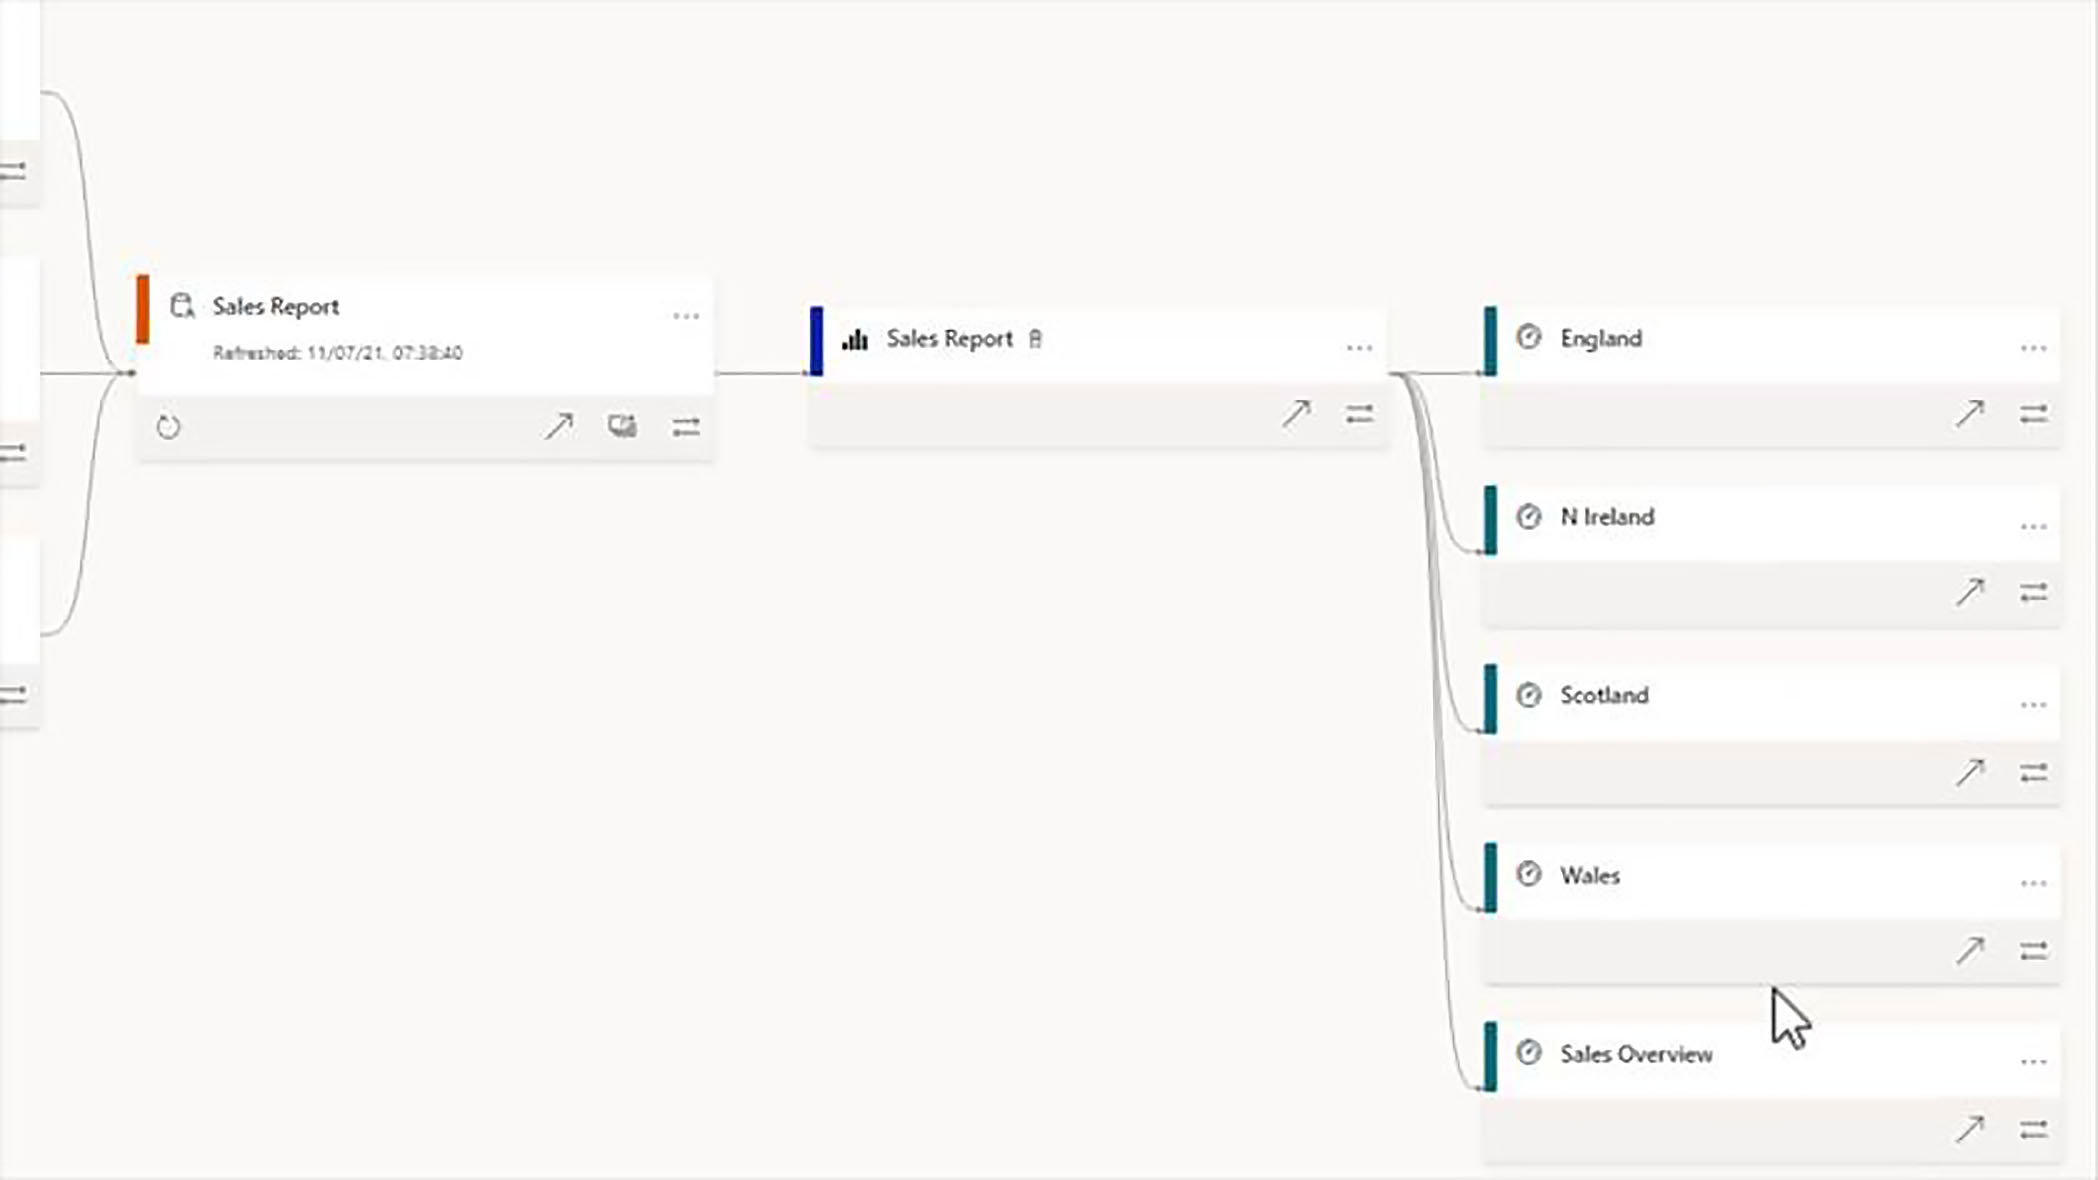
We can also see that this dataset has been shared. So, it is possible for users to build reports on this dataset and upload them into other workspaces. Then we see the report that is been built from that dataset, and then finally, a series of dashboards, which all have dependencies on that sales report.
Show Lineage
In the bottom right of each of the items in the cluster, we have a button marked show lineage. When we click on this, we are given a very clear overview of the dependencies on the selected item.
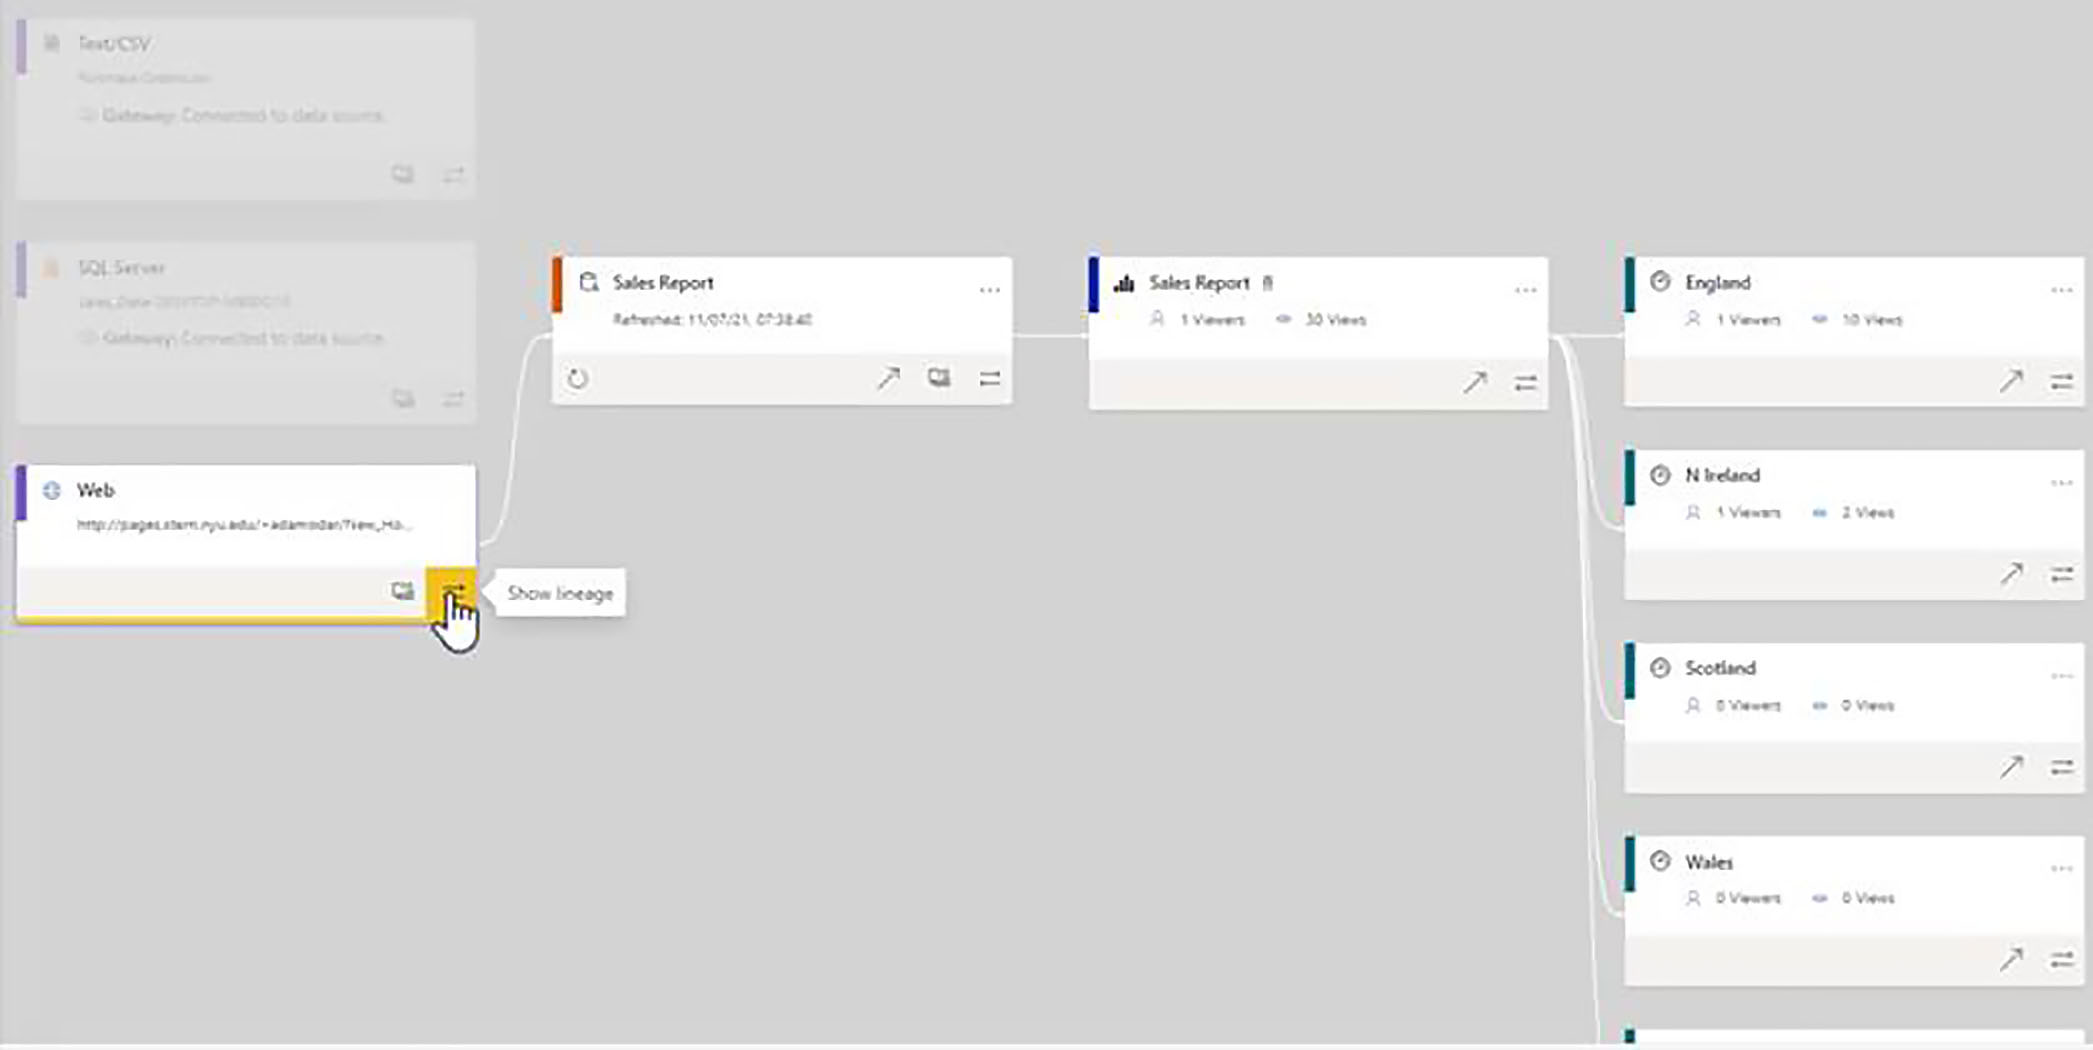
In this example, we can see that selected data source is used in the dataset, it is used in the report, and it is used in the various dashboards as well.
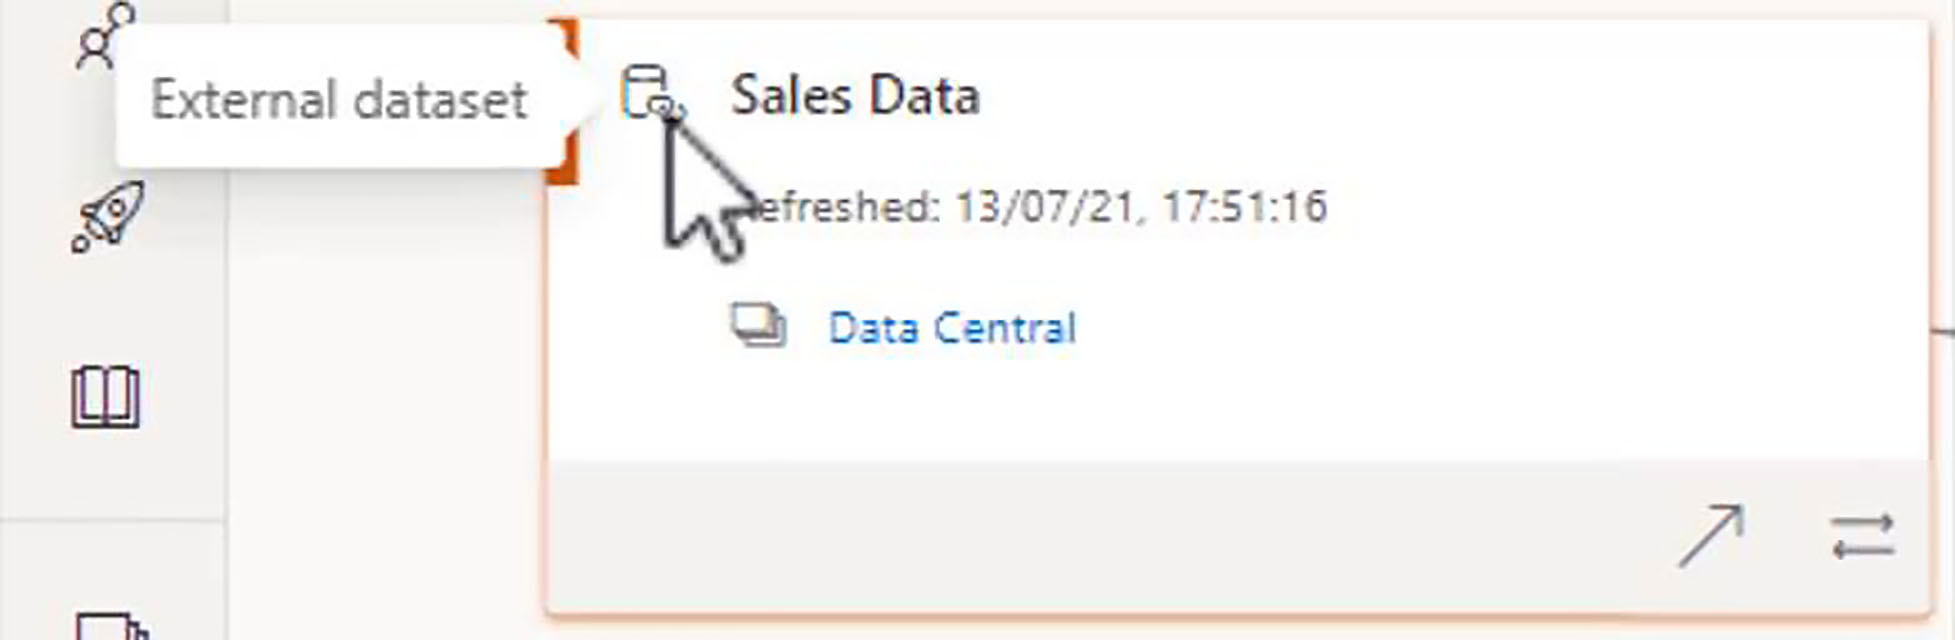
Local and External Datasets
The above cluster is entirely located within the current workspace, the UK Sales workspace. If we move down to the next cluster, we have an example of a dataset, which is coming from another workspace, and this is referred to as an external dataset, and you will see it has its own icon when we hover over the icon, that tooltip tells us that this is an external dataset, and you will notice that we have a link, which will enable us to navigate to that location.
From that external dataset, we have created four reports, and then we have created one dashboard from each of those reports.
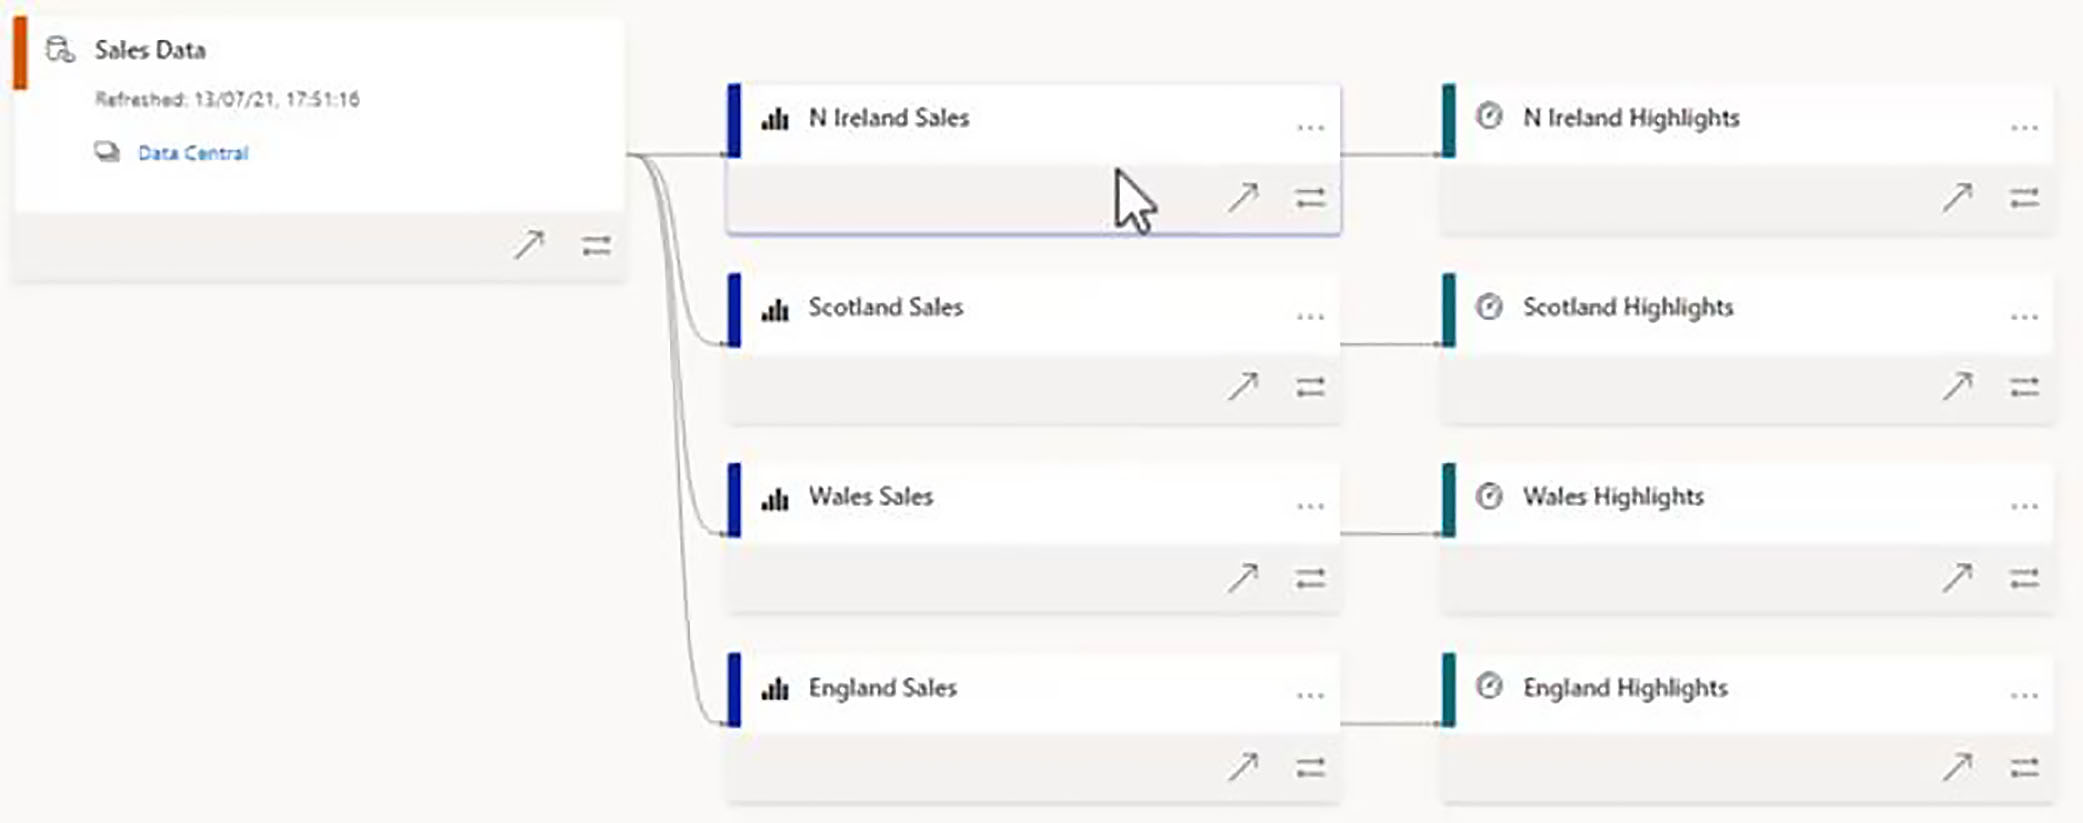
Next, let us click on the Data Central link to navigate to the workspace that contains this dataset.
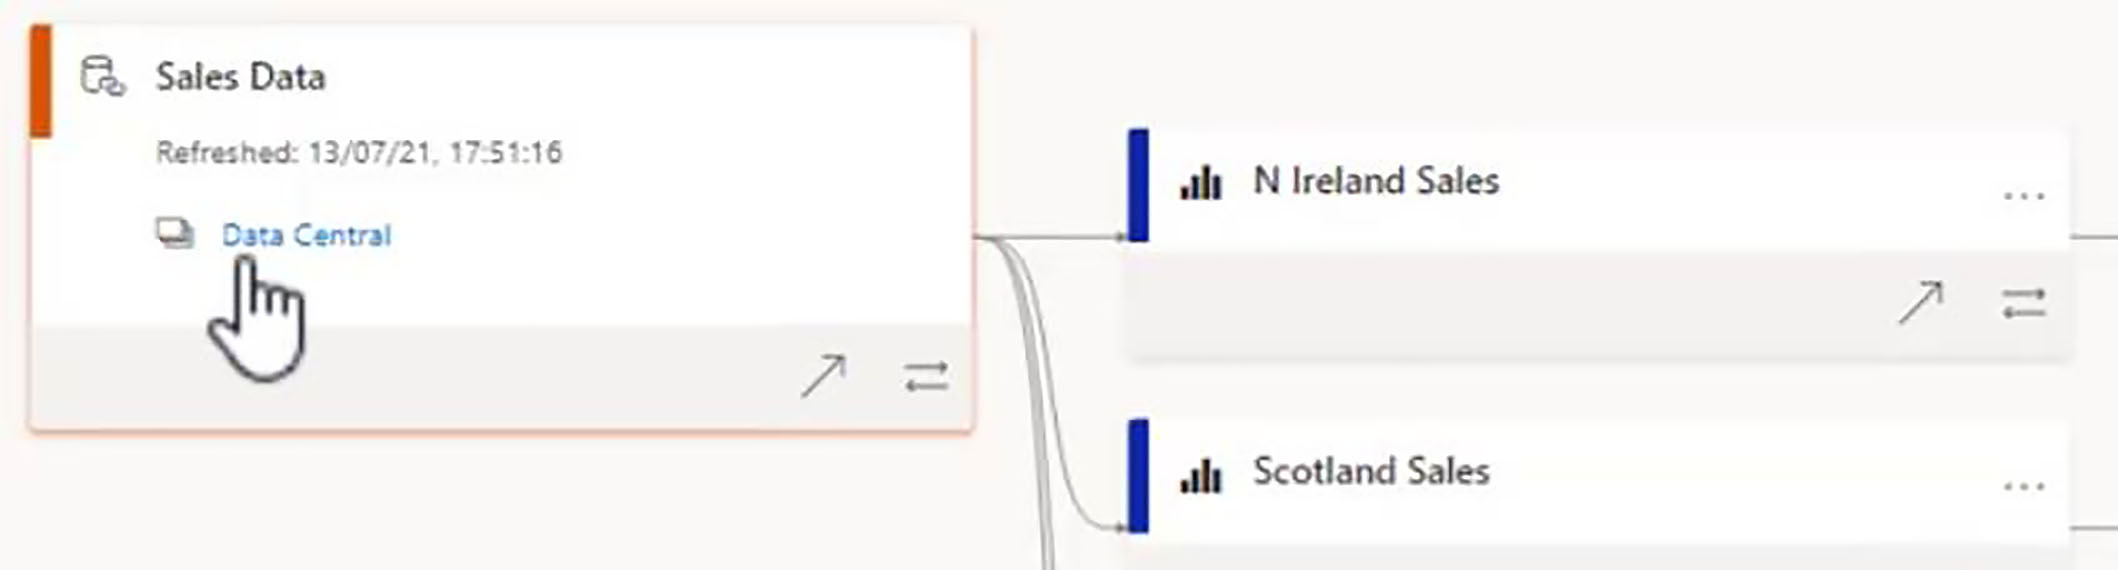
We remain in lineage view, and we are now taken across to the Data Central workspace, where our sales data dataset is located.
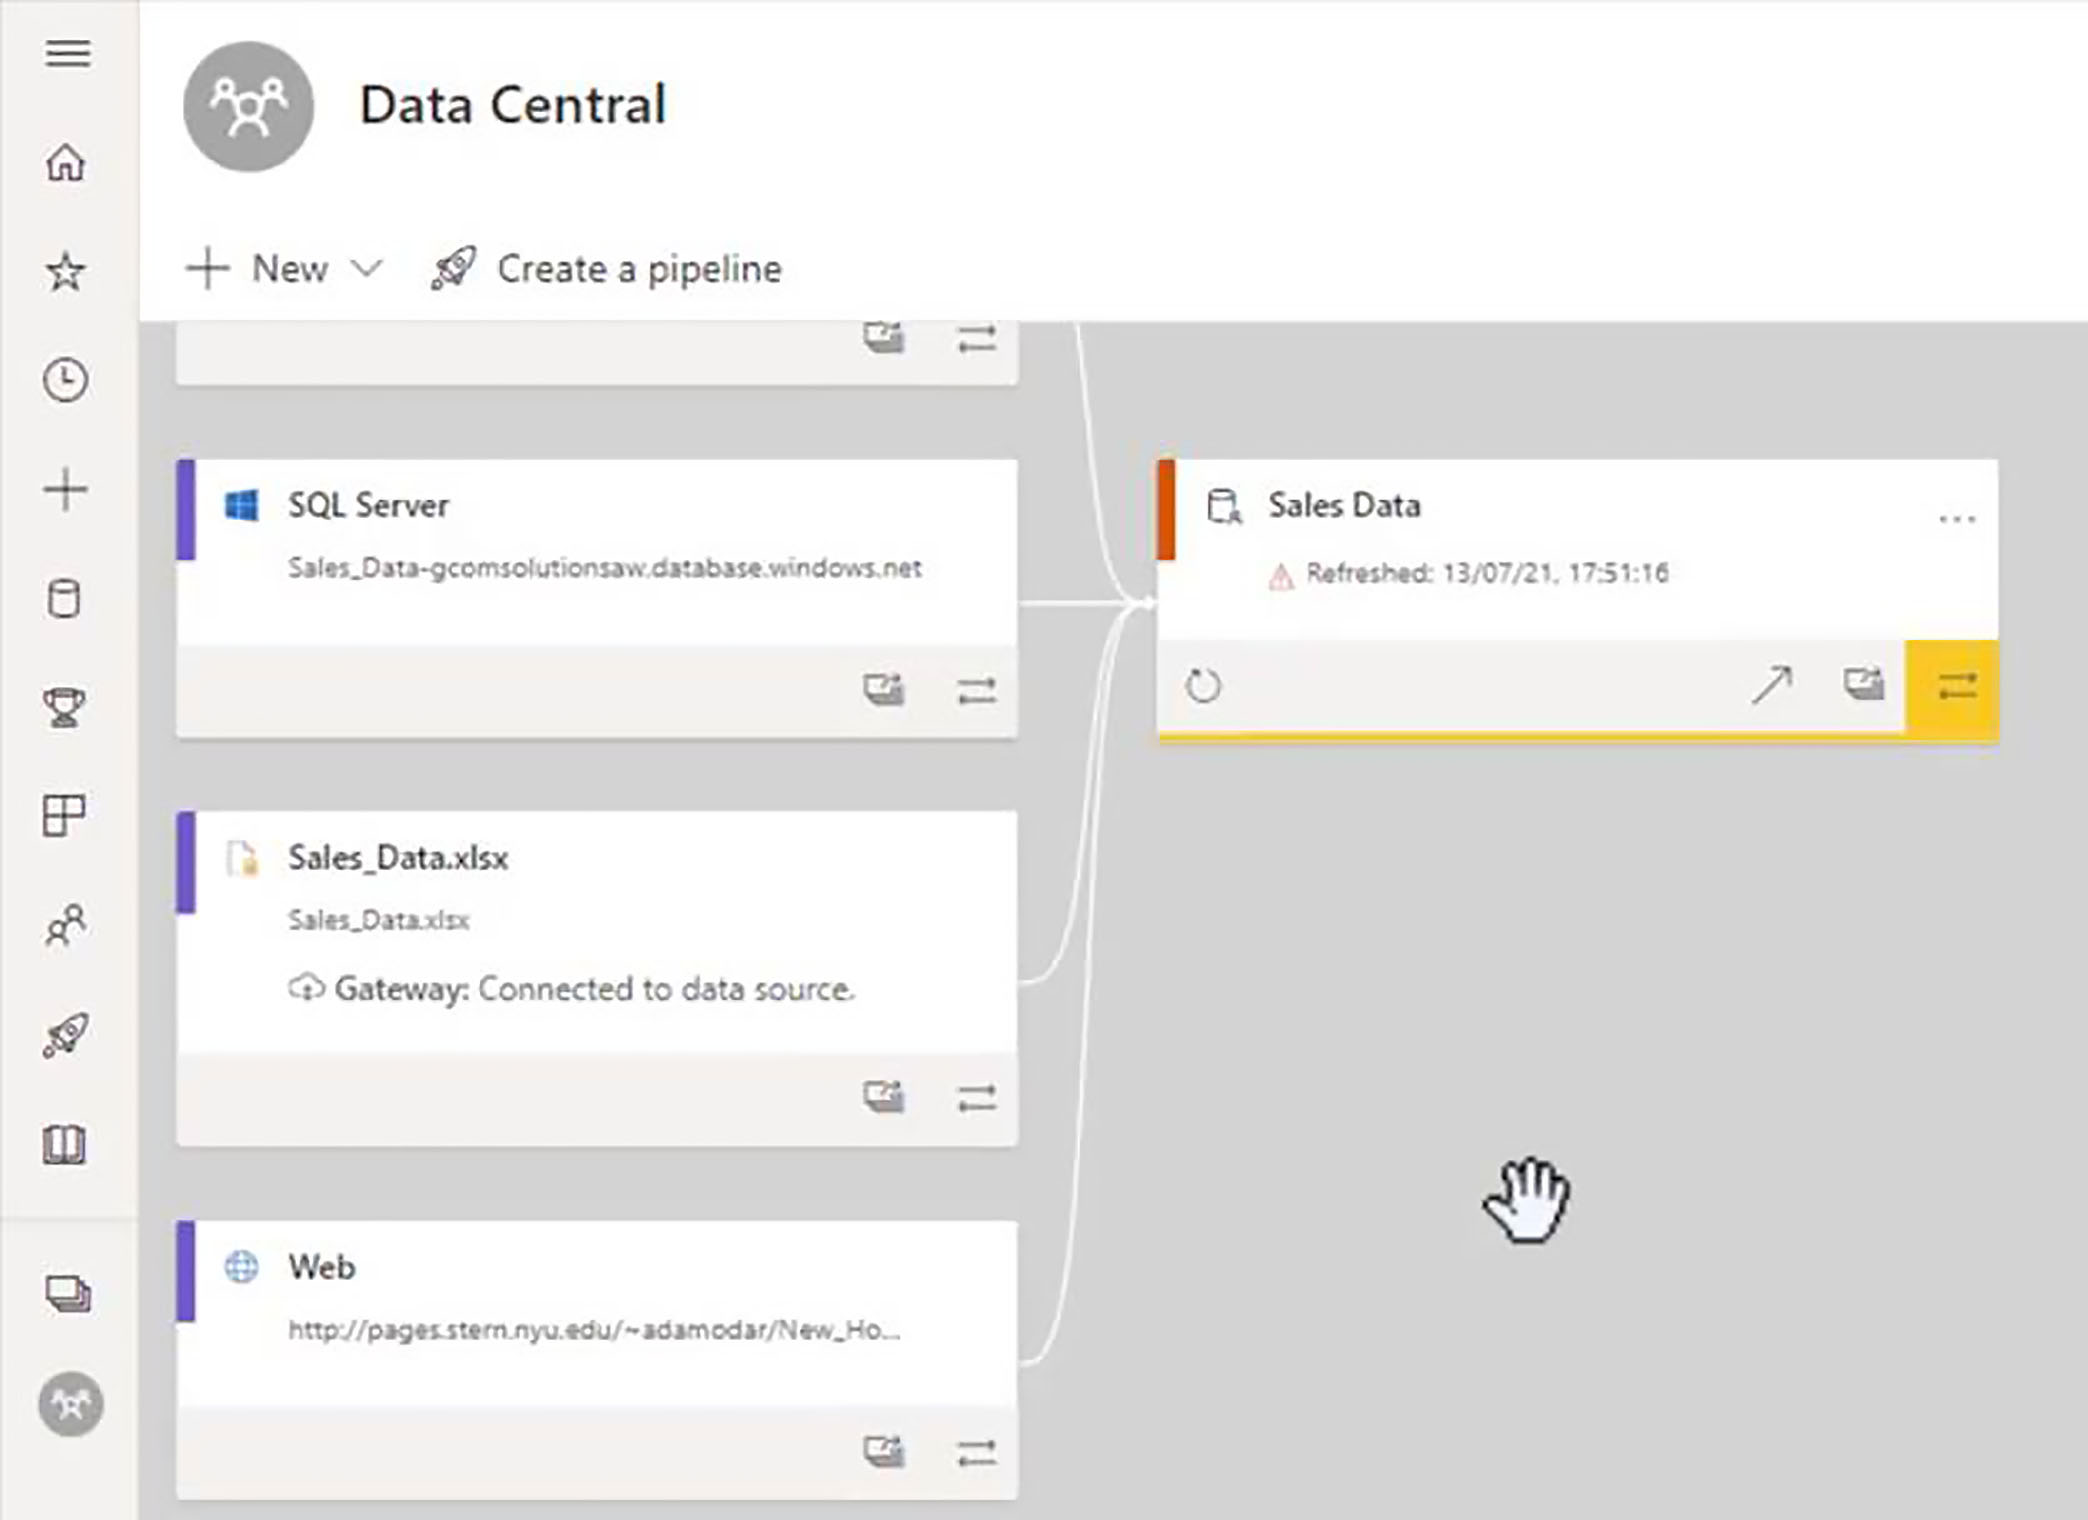
We can see each of the data sources on which this dataset is built. We have a couple of Excel files, a SQL Server database, and a web source.
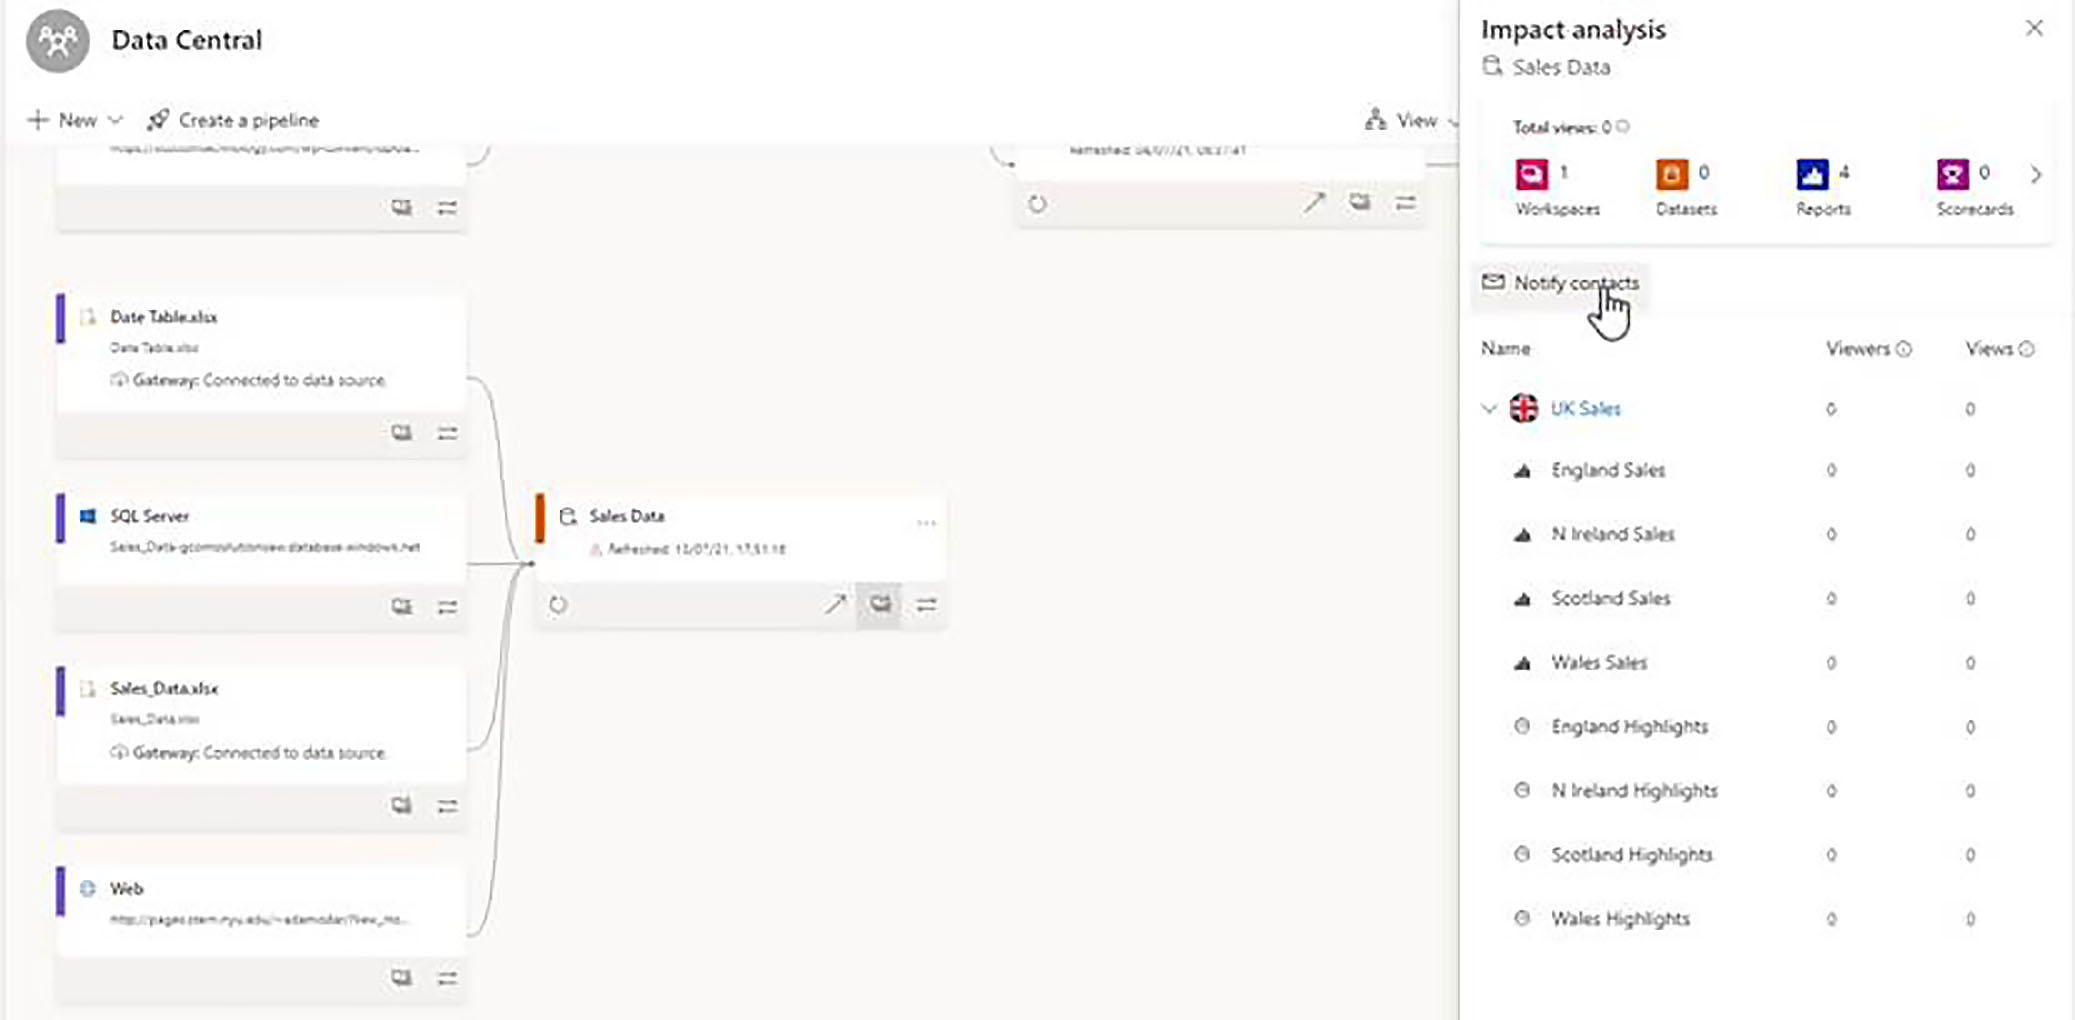
Viewing Impact Analysis
However, that the diagram does not show us the reports that may have been built from this dataset, and this is where the Impact Analysis screen comes in.
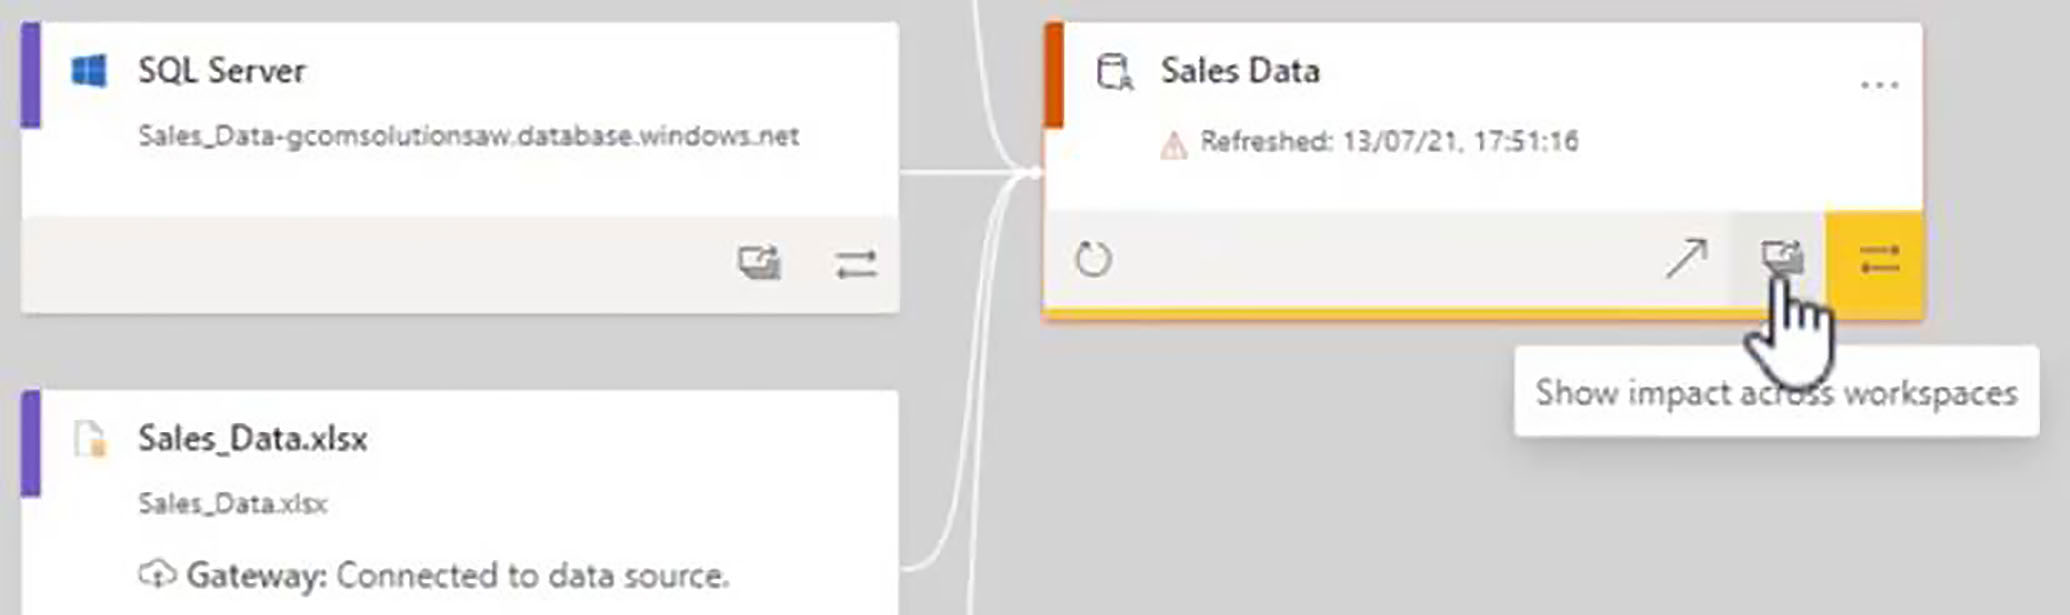
If we click on the button which says, "Show impact across workspaces", the Impact Analysis pop-up appears, and this gives us a very good overview of how the dataset is being used within the Power BI tenant.
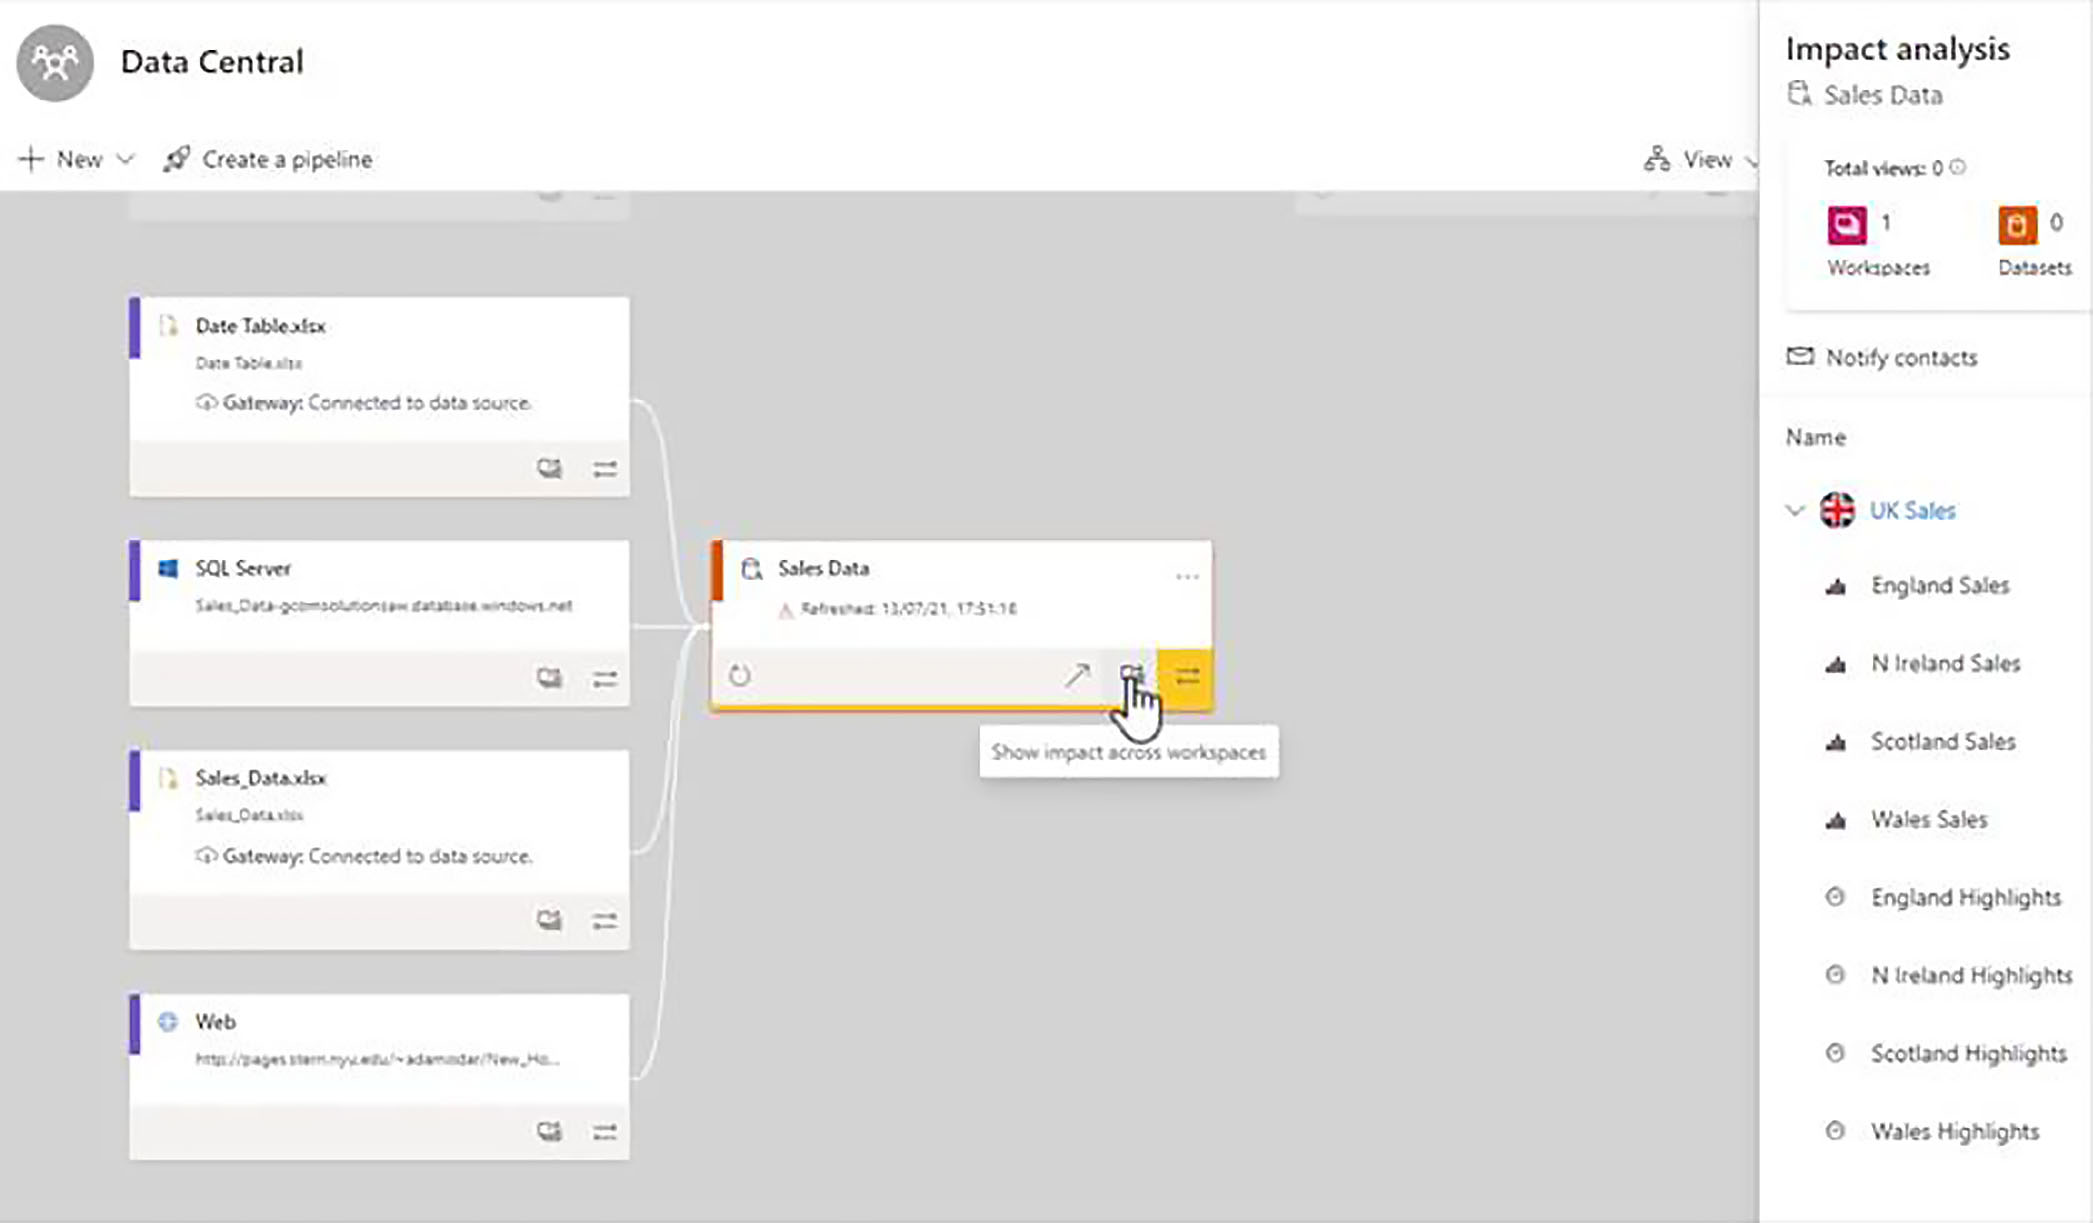
We have one section for each of the workspaces from which this dataset has been referenced, and at the moment, there is only one other workspace, which is the UK Sales workspace, where we started.
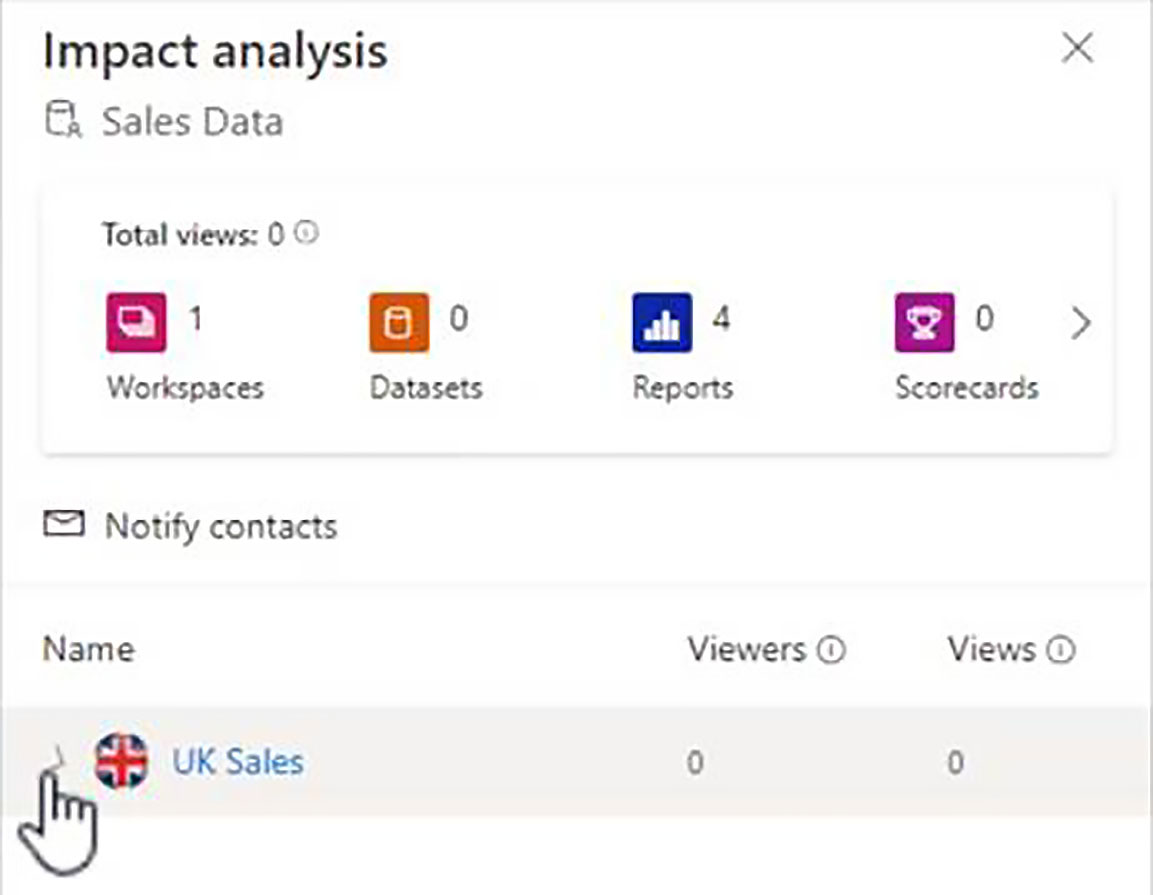
When we expand UK Sales, we get a list of all the reports and all the dashboards that have been built from this dataset.
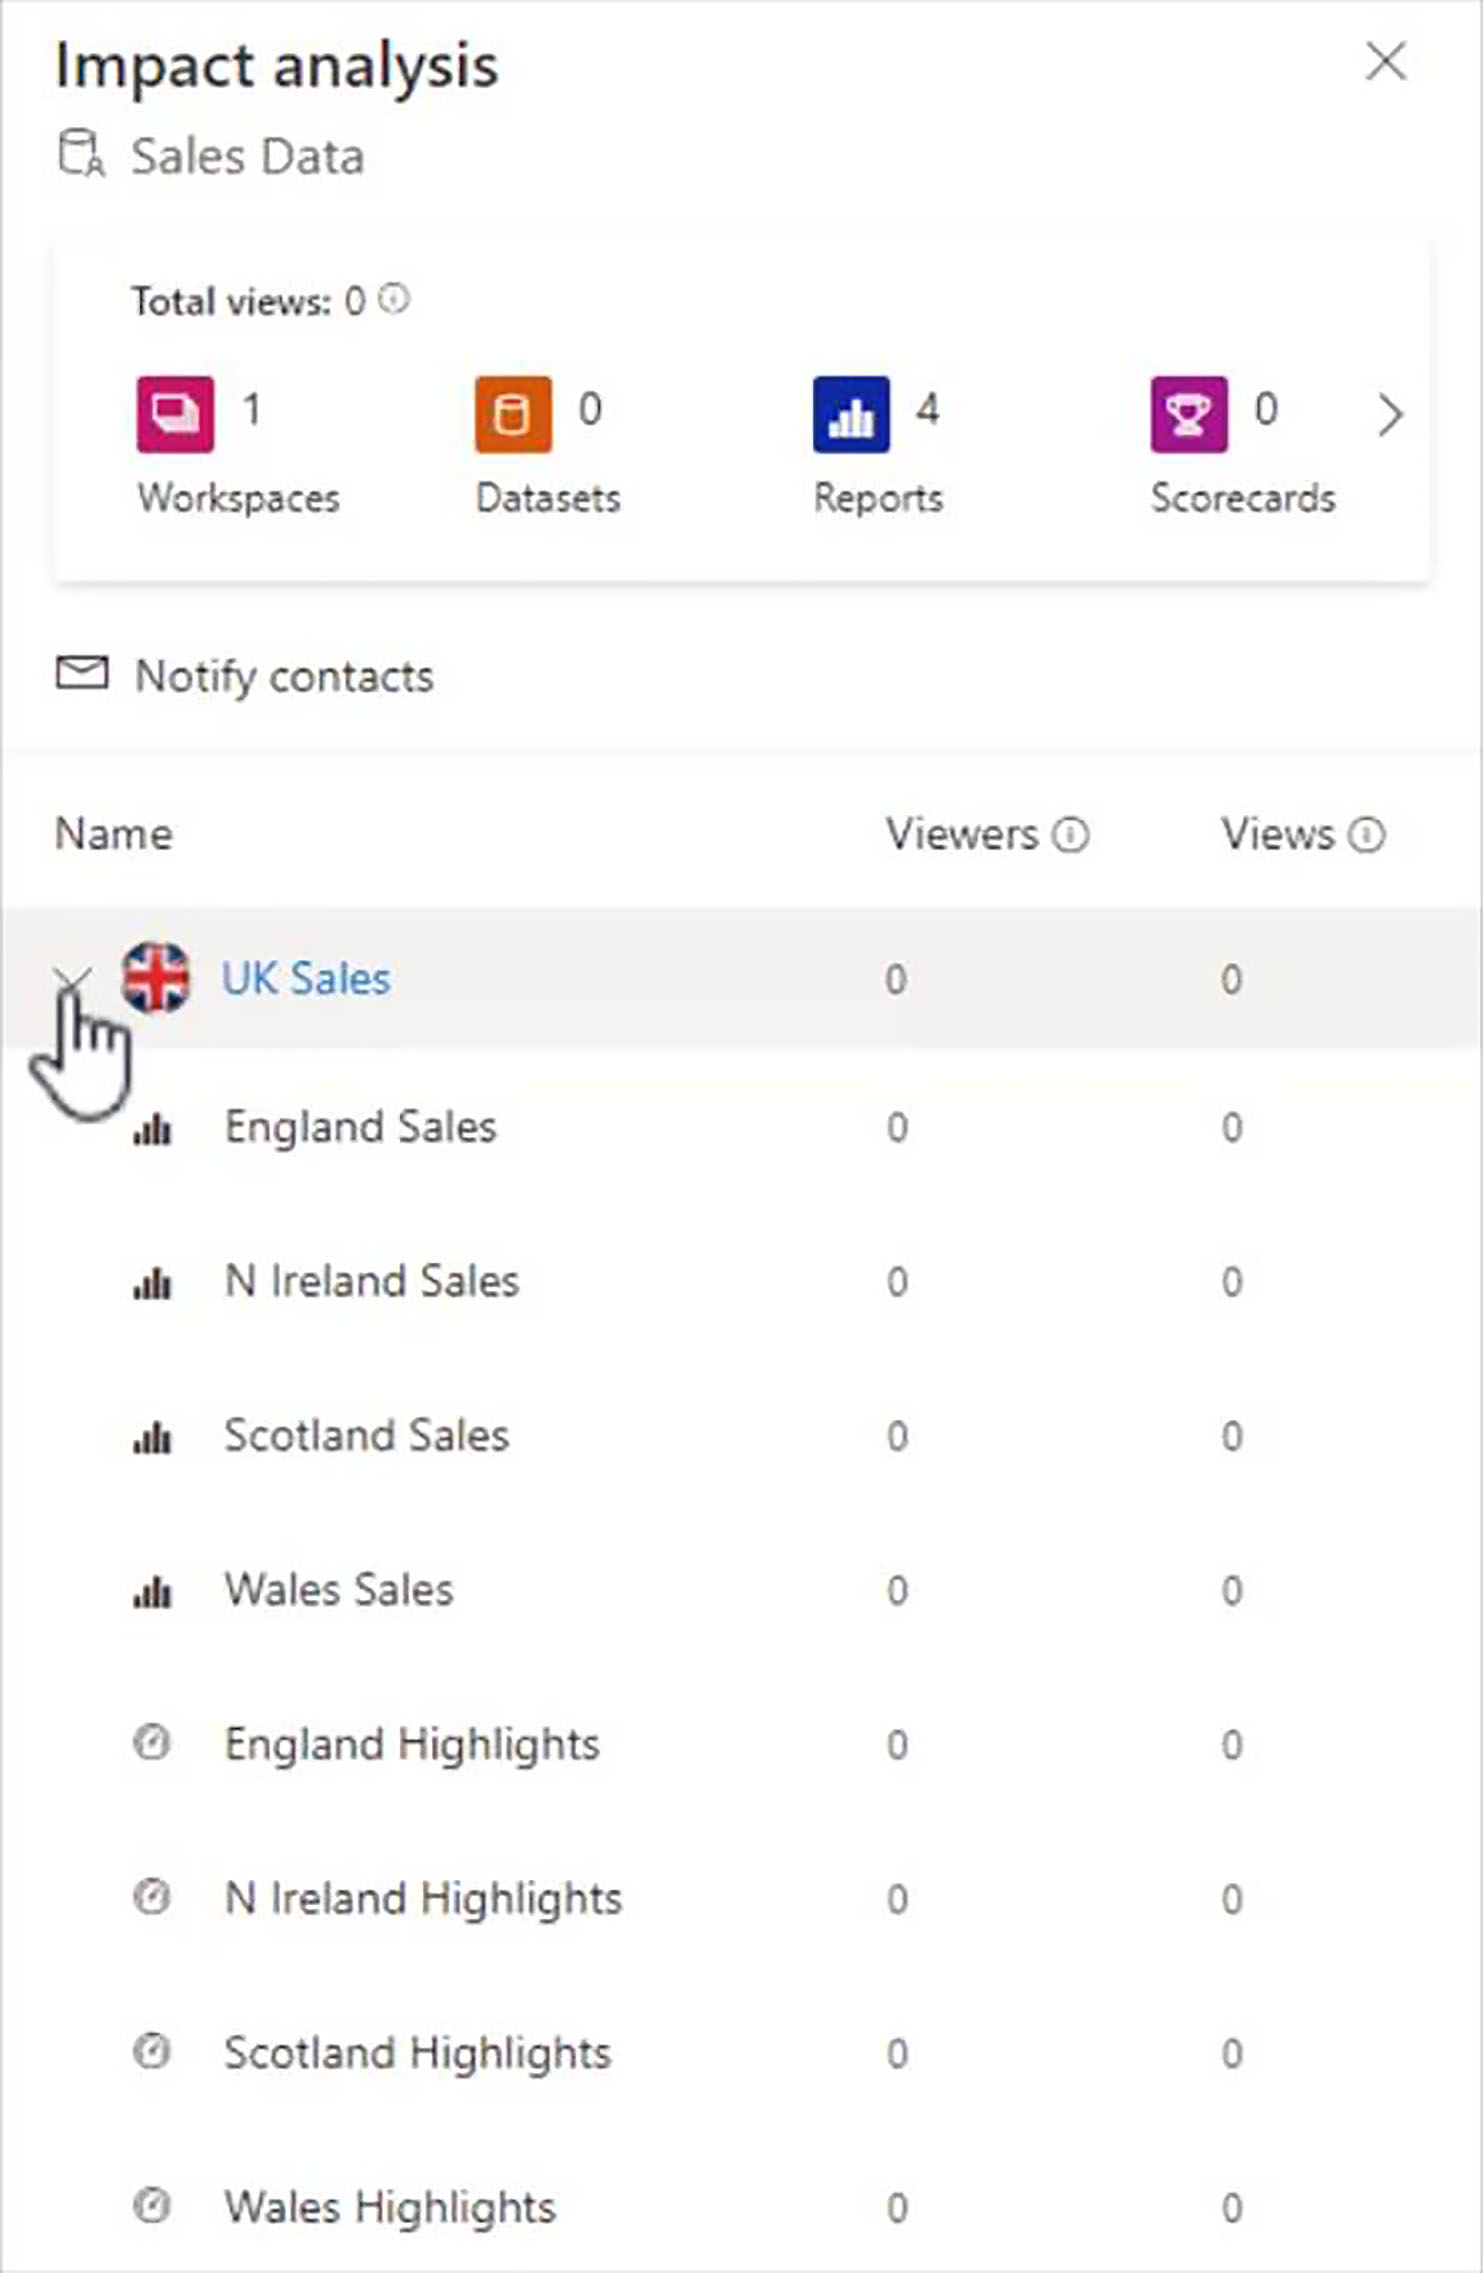
When we were up and running, we will also be given some useful stats as to who is viewing the content, and how many views are coming from each of those viewers.
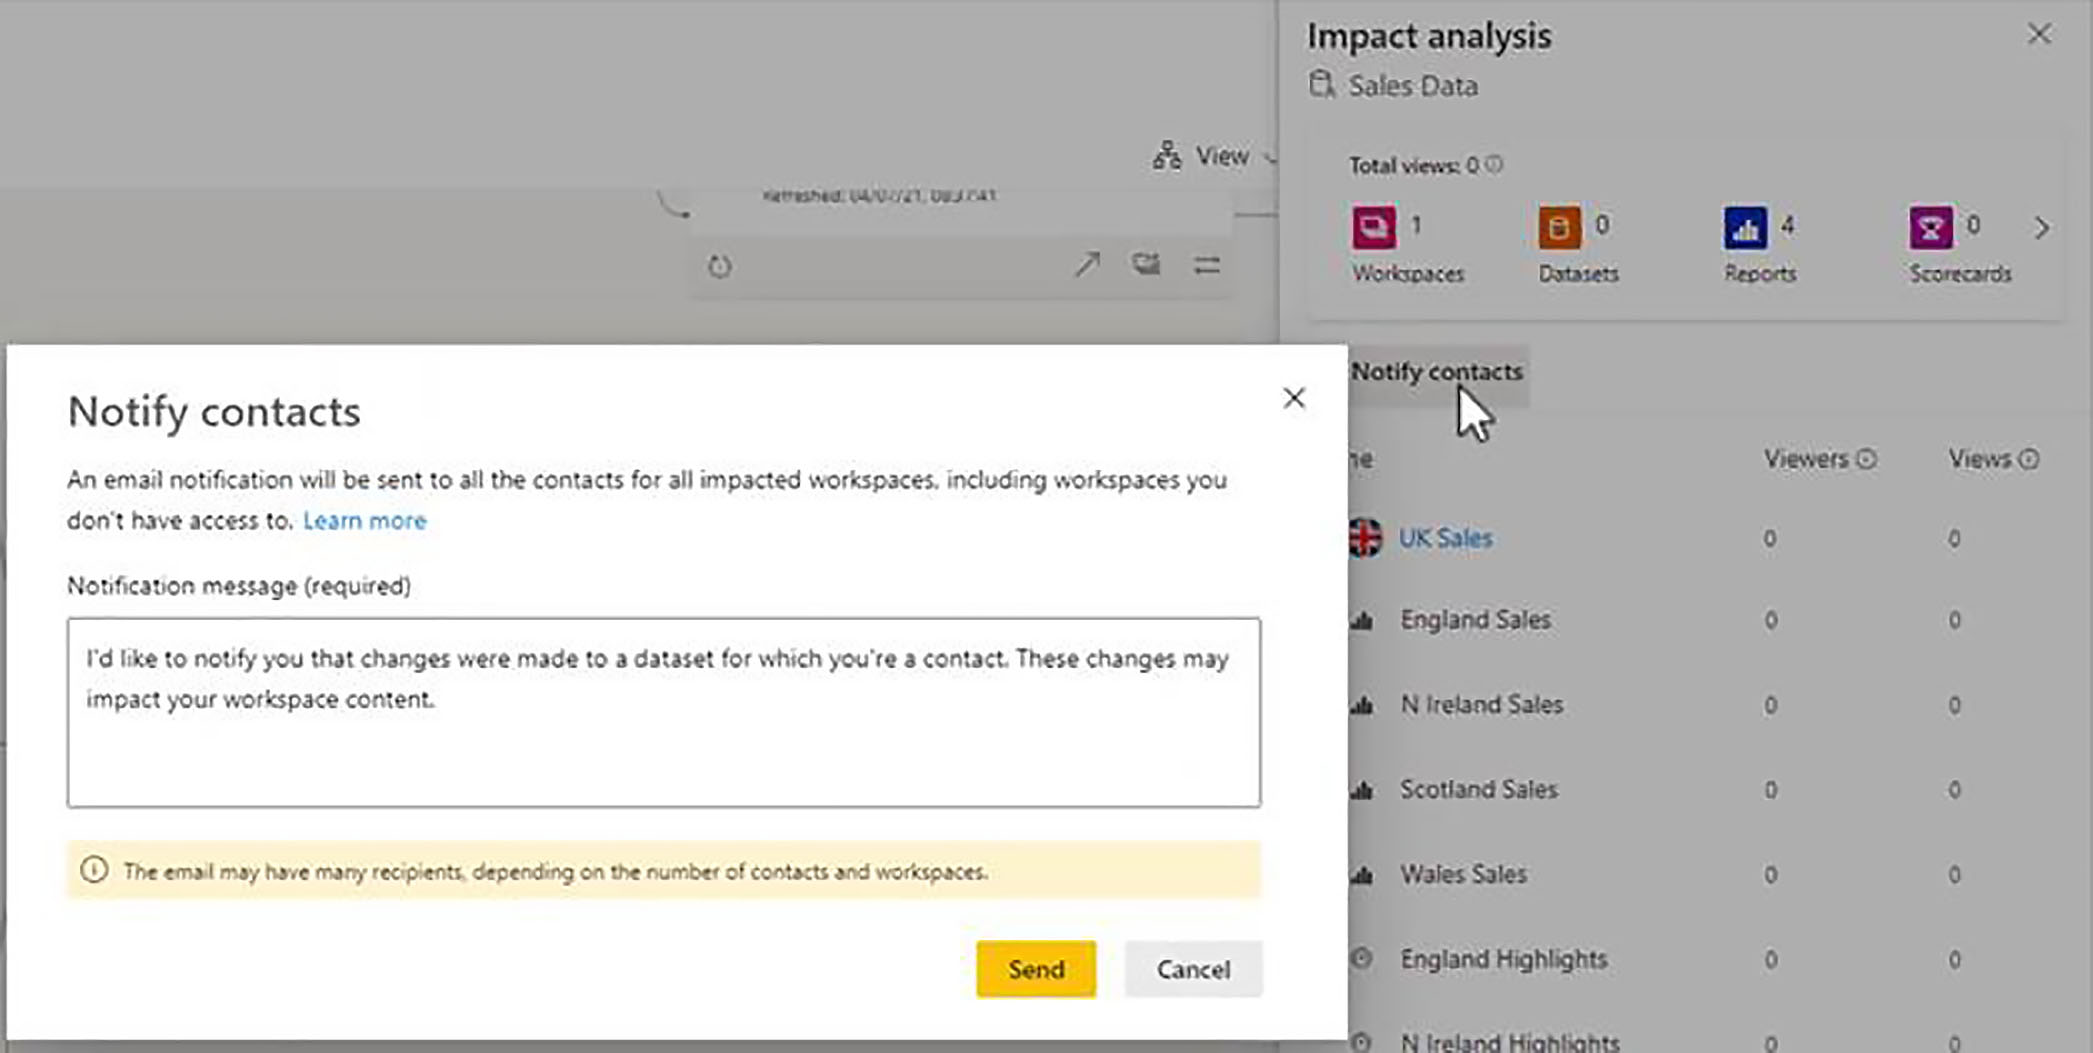
Sending Notifications
We also have a useful button here for sending out notifications to the contacts associated with this workspace. For example, if we were about to make impactive or potentially impacted changes to the dataset, we might want to notify people who have built reports from that dataset.
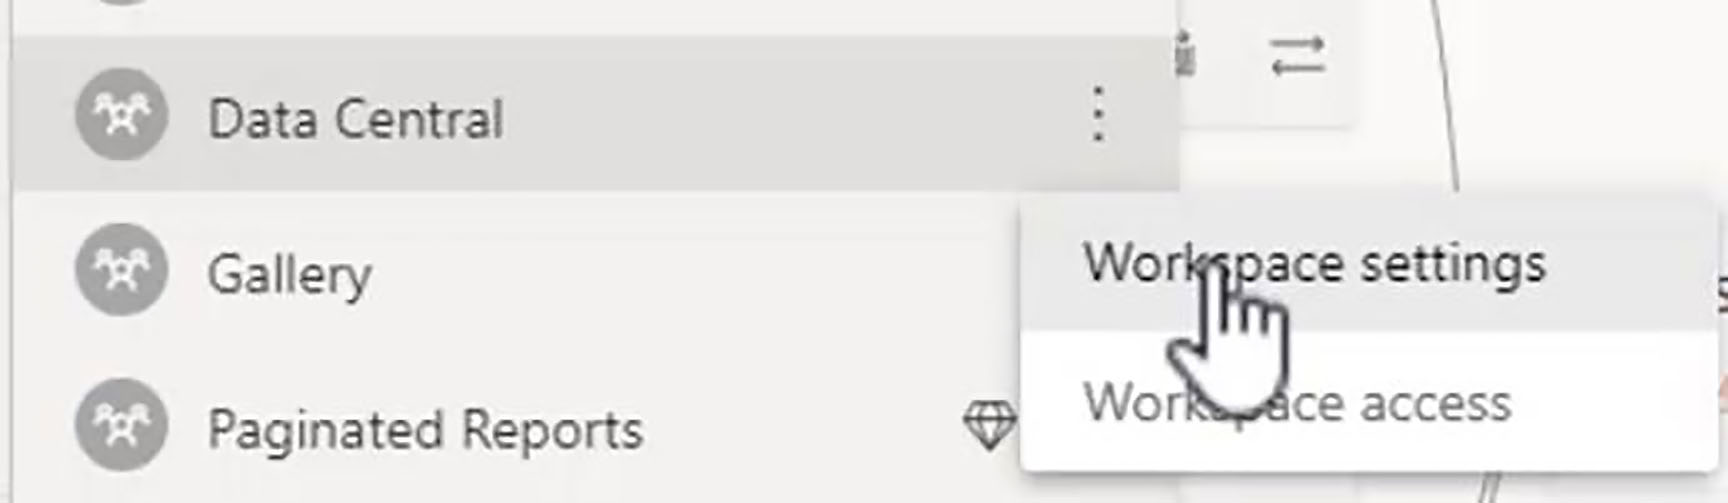
To determine who gets notified, we click on the ellipsis menu next to the name of the workspace (In this case "Data Central") and go into workspace settings.
In the advanced section, we can specify the contact list. By default, the list includes anyone who has admin access to this workspace. However, alternatively, we can choose specific users and groups and then reference either individual users or security groups.
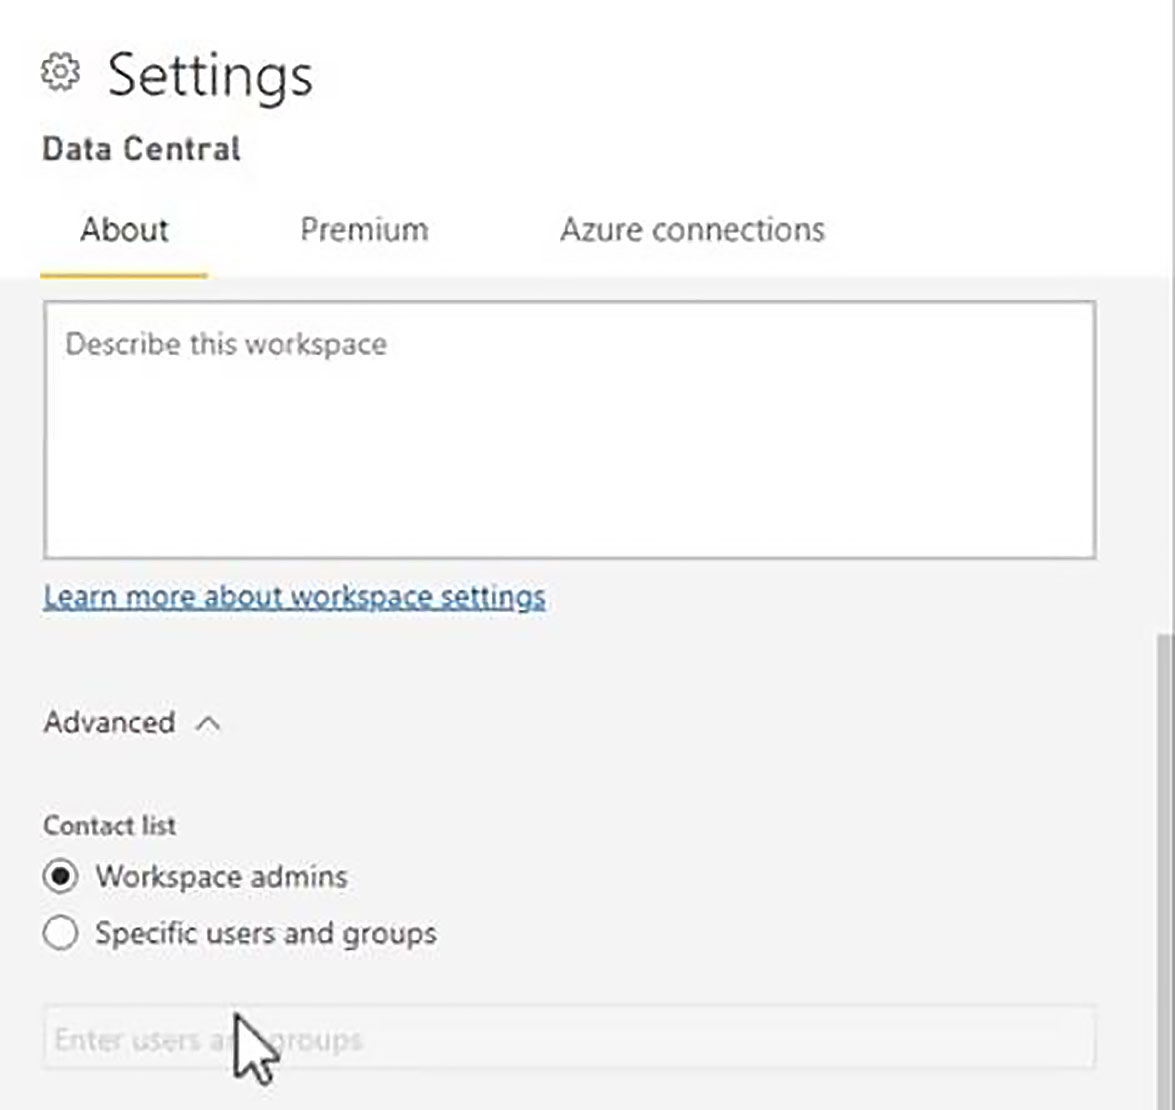
These are the people that will be notified when we click on notify contacts.
So, that is an overview of the two areas relevant to this topic; just be aware of how to use lineage view to track dependencies on the objects within a workspace, and also to use the impact analysis feature to get an idea of how changes that you may make to your datasets could have an impact on downstream artefacts.