- You are here:
- Home »
- Blog »
- Power BI »
- Getting Started with Power BI – Pt 2

Getting Started with Power BI – Pt 2
Part 2 (of 4): Working in the Query Editor
Click here to download the tutorial work files
Let us now look in a bit more detail at the three parts of Power BI that we saw earlier: Power BI Desktop, the Power BI service and Power BI mobile apps. We will begin by looking at Power BI Desktop.
When you launch Power BI Desktop and look at the interface, you will probably notice that it has a very Microsoft-like interface with a ribbon and a series of tabs. And, as is usual on a Microsoft Ribbon, the Home Tab contains all of the most frequently used options.
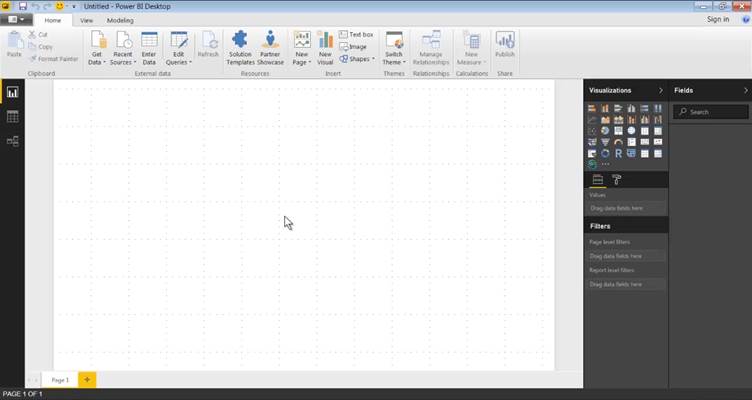
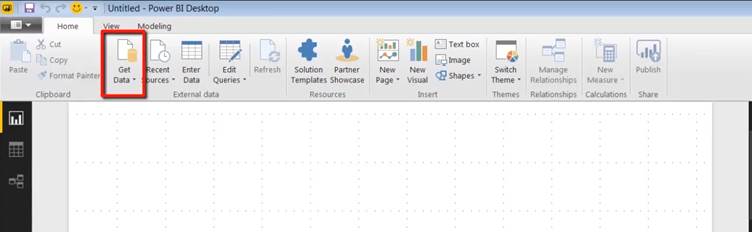
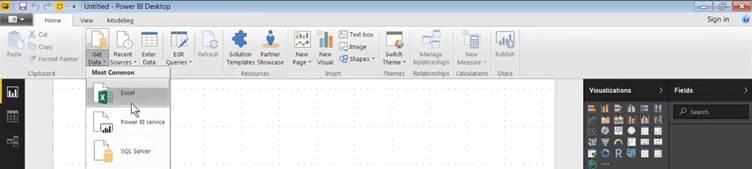
The first thing you do when you're working on any kind of project in Power BI Desktop is to grab yourself some data. You do this by going to the Home Tab, clicking on Get Data and choosing the appropriate option.
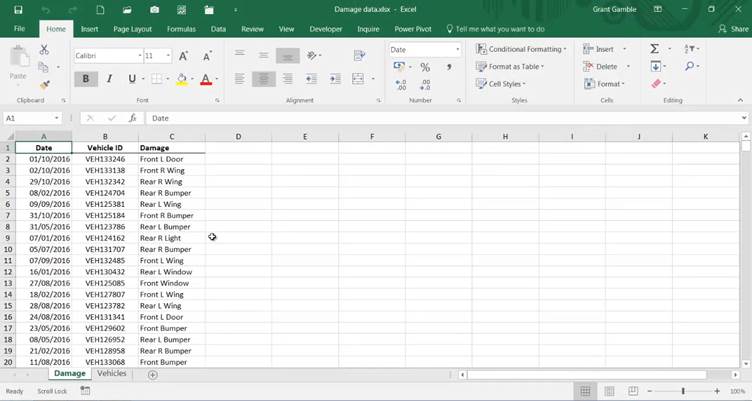
By way of orientation, let's dive straight in and get our hands dirty by completing a small project. First of all, we will examine the data. In the tutorial folder, open the file called "Damage data.xlsx". It contains two worksheets. The first ("Damage") contains lists each of the areas of a fleet of vehicles which have any kind of damage.
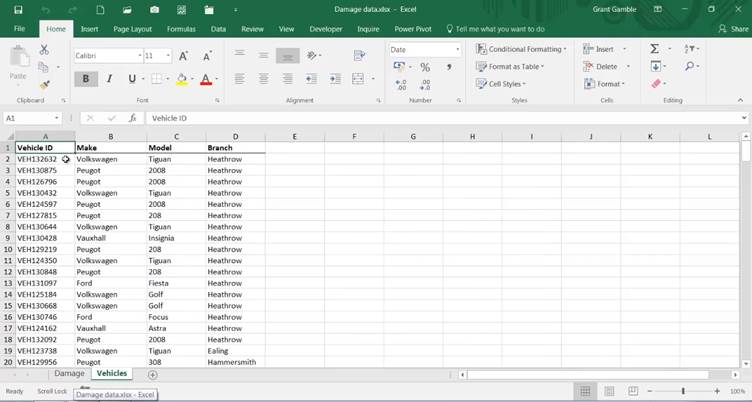
The second sheet ("Vehicles") gives details about the vehicle; it tells us the make, the model and at which branch the vehicle is stored.
Now that we know that the data we want to import is Excel data, back in Power BI Desktop, in the Home Tab of the Ribbon, click on Get Data and choose Excel.
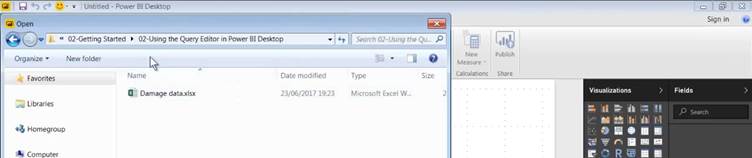
Next, navigate to the tutorial folder and double-click on "Damage data.xlsx" to import it.
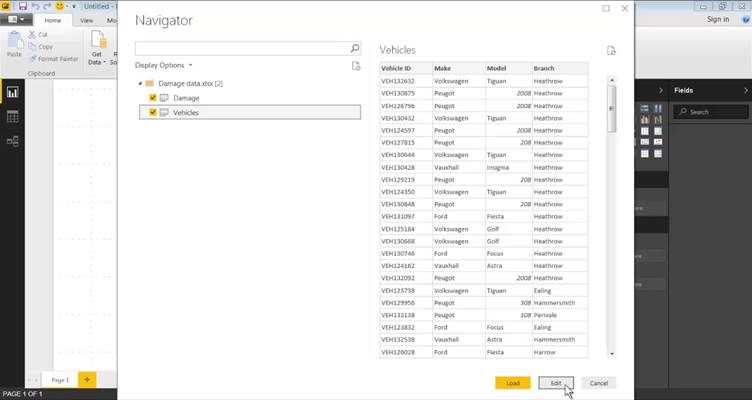
When the Navigator appears, you will see the two worksheets that we saw earlier; and on the right, you can display a preview of the contents of each worksheet by clicking on its name. We want to import both worksheets; so click in both checkboxes to activate them. We can then either click on Load, which will make the worksheets available for immediate use, so we can start building our report straightaway; or and we can click on the Edit button, which will take us into the Query Editor. Let's do the latter.
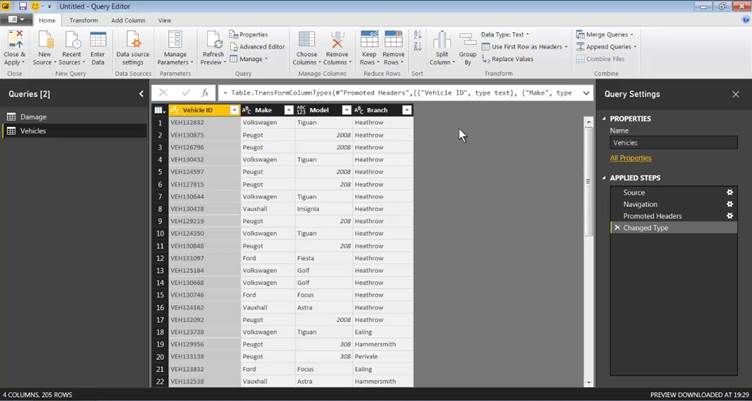
In the Query Editor, we can make all manner of transformational changes to the data as it is brought into Power BI. Since this is our first visit, we are not going to go into too much detail; for the moment, we will just get a flavour of what happens in the Query Editor. Basically, the Query Editor allows you to set up a series of rules which will be applied whenever you connect to a particular data source.
Some of these rules are created automatically; you can see them listed on the right in the Query Settings pane: "Source", "Navigation", "Promoted Headers" and "Changed Type". All of these steps were generated automatically when the data was brought into the Query Editor.
Let us perform one additional transformation to give you an idea of how the process works. Let's say that we want to add an extra column to the "Vehicles" table which displays both the make and the model of each vehicle.
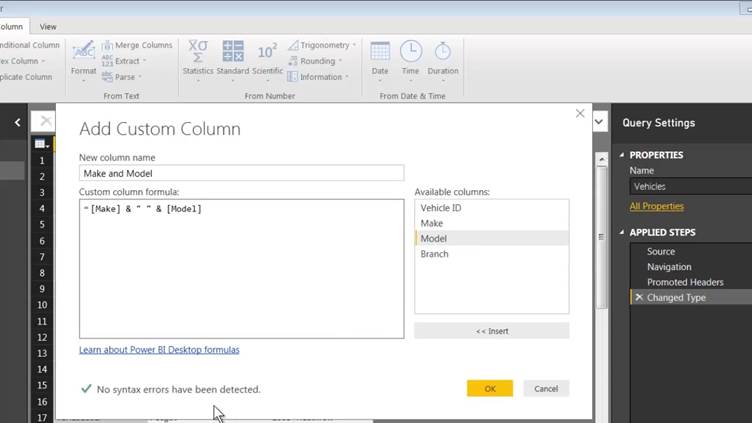
Make sure that the "Vehicles" query is highlighted in the Queries pane on the left of your screen; then click on the Add Column Tab. Click on Custom Column and, at the top of the "Add Custom Column" dialog, enter the name "Make and Model".
On the right of the dialog, you will see all of the existing columns available; so we can simply double-click on the Make column and the syntax will be automatically generated for us. Next, we need the concatenation operator ("&") which you may well have encountered in Excel. It is exactly the same in Power BI, ampersand. We want to concatenate a space, which of course has to go inside double quotes (again just like in Excel). Then we need anther ampersand and, finally, we double-click to insert the syntax for the Model column. We have no syntax errors; so we can click OK.
However, you will notice that our new column displays an error every time the model of a car is purely numeric. One of the things about concatenation, which is the operation we have just performed, is it has to be performed on textual values.
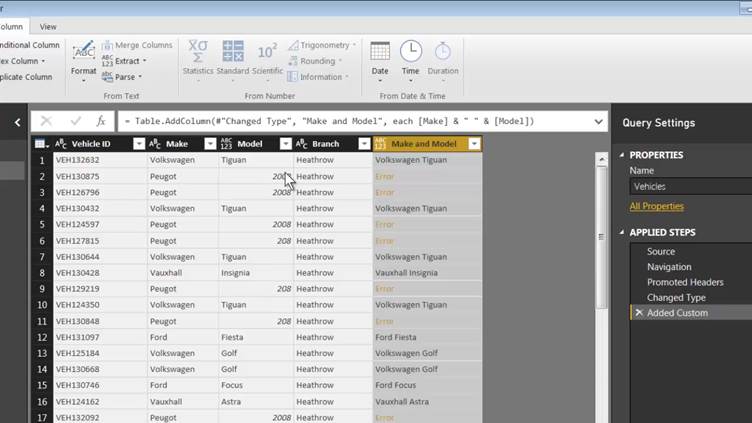
One of the really cool things about working in the Query Editor is that in order to get rid of an error, you often don't need to remove everything you've just done; you can sometimes go back to previous step, perform an additional step and correct the error that way.
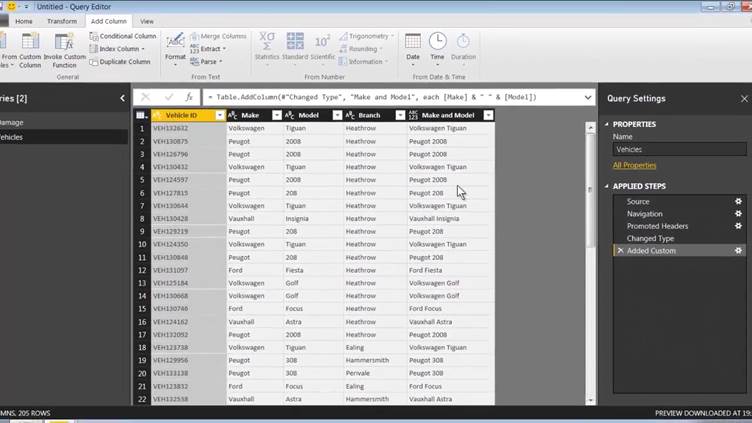
Click on the "Changed Type" step. (You will notice that the preview changes to show what the data looked before this step was performed.) What we now need to do is to explicitly make this column a text column. To do this, let's click on the left of the column heading and choose Text from the context menu; and, when the dialog appears, confirm that we would like to insert a new step.
When we go back to the final step, we can see that the errors have disappeared because we are now trying to concatenation two text values.
That is all we will do in the Query Editor for this mini project.
When you are working in the Query Editor, you always have two Power BI windows open: the Query Editor window and the report window, which is always underneath. Because we have made changes in the Query Editor and have not applied those changes, a yellow bar will always be displayed until we apply our changes.
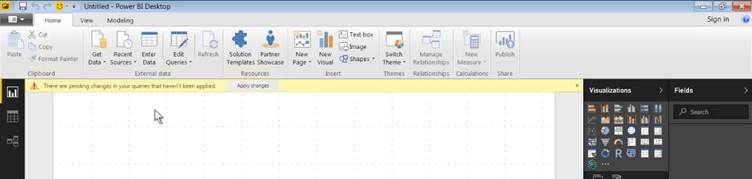
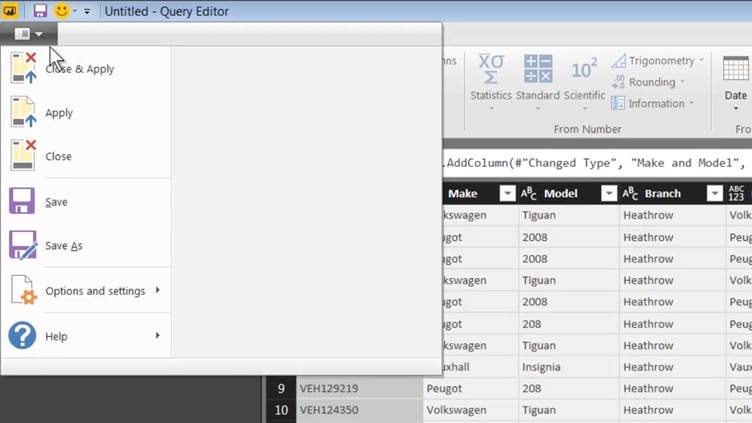
The normal way of applying the changes made in the Query Editor is to go to the File menu, as I like to call it (even though it doesn't seem to have a label), and choose Close And Apply.
So, we have connected to a data source, carried out a basic transformation on the data; and that data is now available in the data model for use in building reports.
In the next tutorial in this series, we will have a look at how to use our data to construct a report.