- You are here:
- Home »
- Blog »
- Power BI »
- Power BI MCSA Certification Training Tips – Part 12: Power Query Custom Functions

Power BI MCSA Certification Training Tips – Part 12: Power Query Custom Functions
To obtain your MCSA: BI Reporting you need to pass two exams: 70-778 (Analyzing and Visualizing Data with Power BI) and 70-779 (Analyzing and Visualizing Data with Excel). However, there is a huge overlap between the two exams resulting from the common BI features found in both Power BI and Excel: namely data modelling using the DAX language; and data connection and transformation using the M language.
We, at G Com Solutions, recommend to the clients to whom we supply Power BI Training that they prepare for both exams simultaneously and then sit both exams on the same day. We also run a 5 day Power BI MCSA Certification Prep course in London which includes both exams 70-778 and 70-779.
In this series of blog posts, we will be examining some of the key features of Power BI, Power Pivot and Power Query which you will need to master in order to pass the two exams.
In this topic, which applies equally to exams 70-778 and 70-779, we discuss the use of custom functions in Power Query.
Functions are found in every programming and development environment and enable users to perform complex calculations without having to constantly recreate complex algorithms. The M language which underlies the Power Query environment is no exception. Each of the commands available in the Query Editor produces results using one or more M functions.
In addition, it is possible to create your own custom function. You can do this either visually (using the Query Editor interface) or by typing the M code yourself. Custom functions enable you to reuse complex logic without having to hunt down the PBIX file in which you first used that particular series of steps. For this reason, functions are often included in templates.
Converting a Query to a Function
To create a function visually, you first parameterize one or more values, then use the Convert to Function command. Let us take an example of how we might use a function to speed up our data preparation workflows.
The ability to connect to a folder of data allows you to combine all the files in a given folder into a single table. But what if you wish to apply that same logic to a series of files in different locations? Ideally, you would want to create a list of files and then use a function to assemble them into a single table.
In this example, we have an Excel file called “List.xlsx” which contains the following list of files.
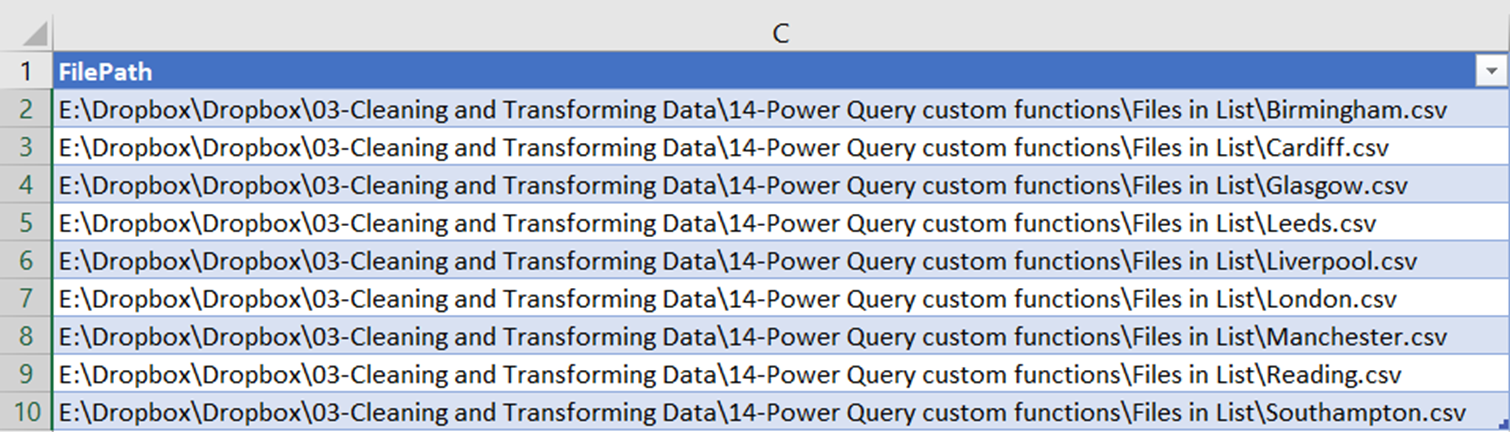
For convenience, all the files are, in fact, in the same folder; however, you will, hopefully, agree that we could also use this technique to list files in a series of disparate locations.
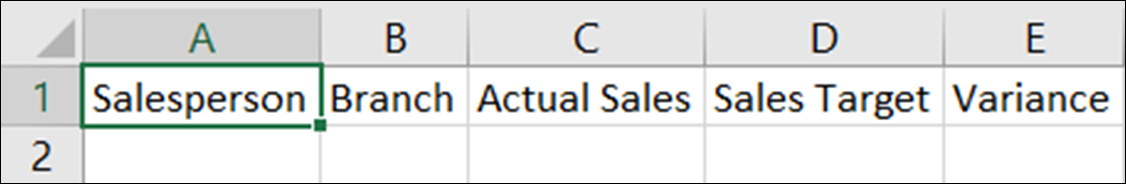
To create our function, we begin by importing a file which has the same structure as the files which we will be combining; specifically, the same column headings. We have prepared such a file; it is called “Example.csv”. If you open the file in a text editor, or in Excel, you will see that it contains only the column headings.
Connecting to our Example file
Our first step is to connect to the file called “Example.csv”, by choosing Home > Get Date > Text/CSV.
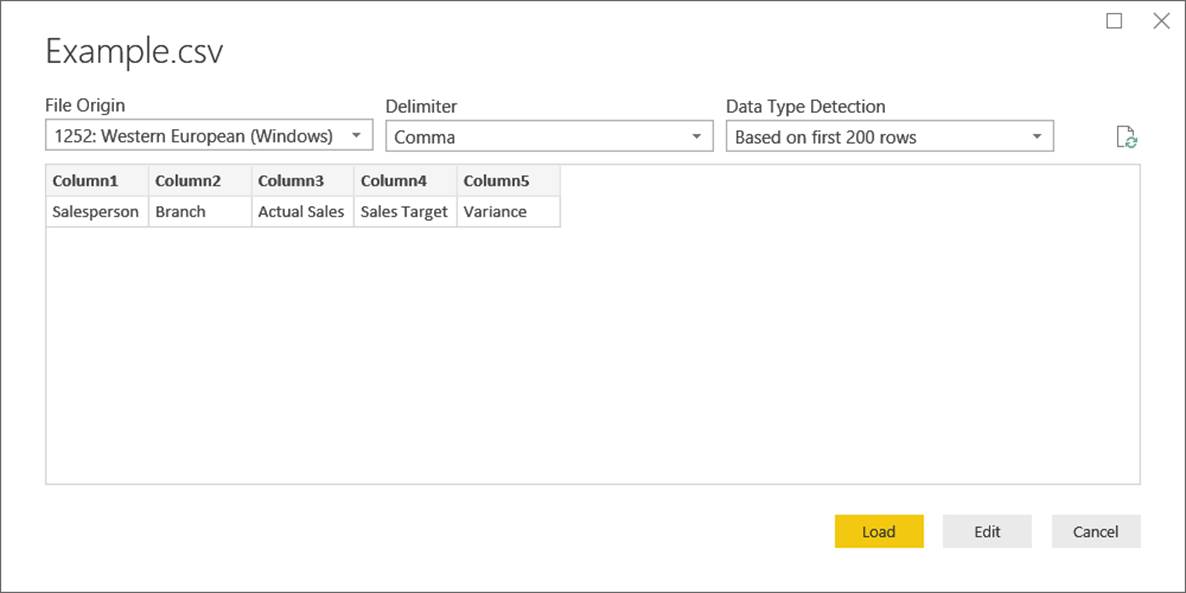
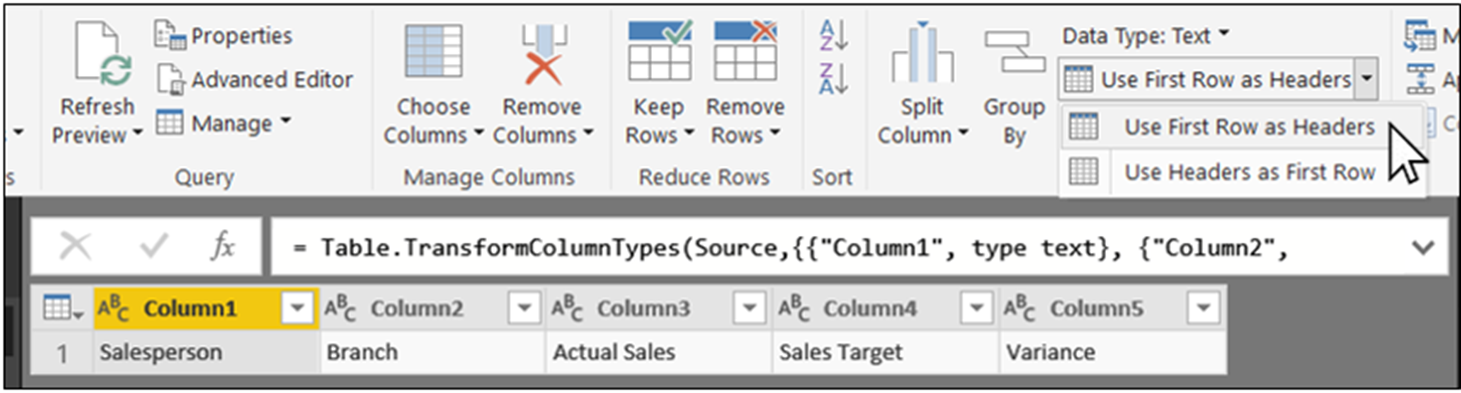
We can see from the preview that the column headers are being treated as data; so, to fix this we need to click on Edit, not Load. Then, we click on Home > Transform > Use first Row as Headers.
This gives us the basic framework of our function. The next step is to add a parameter.
Creating a parameter
For any function to be useful (in any environment), it will normally require one or more parameters. Custom M functions are the same; and the parameters feature which we examined in the last chapter can also provide a visual method of defining a function parameter.
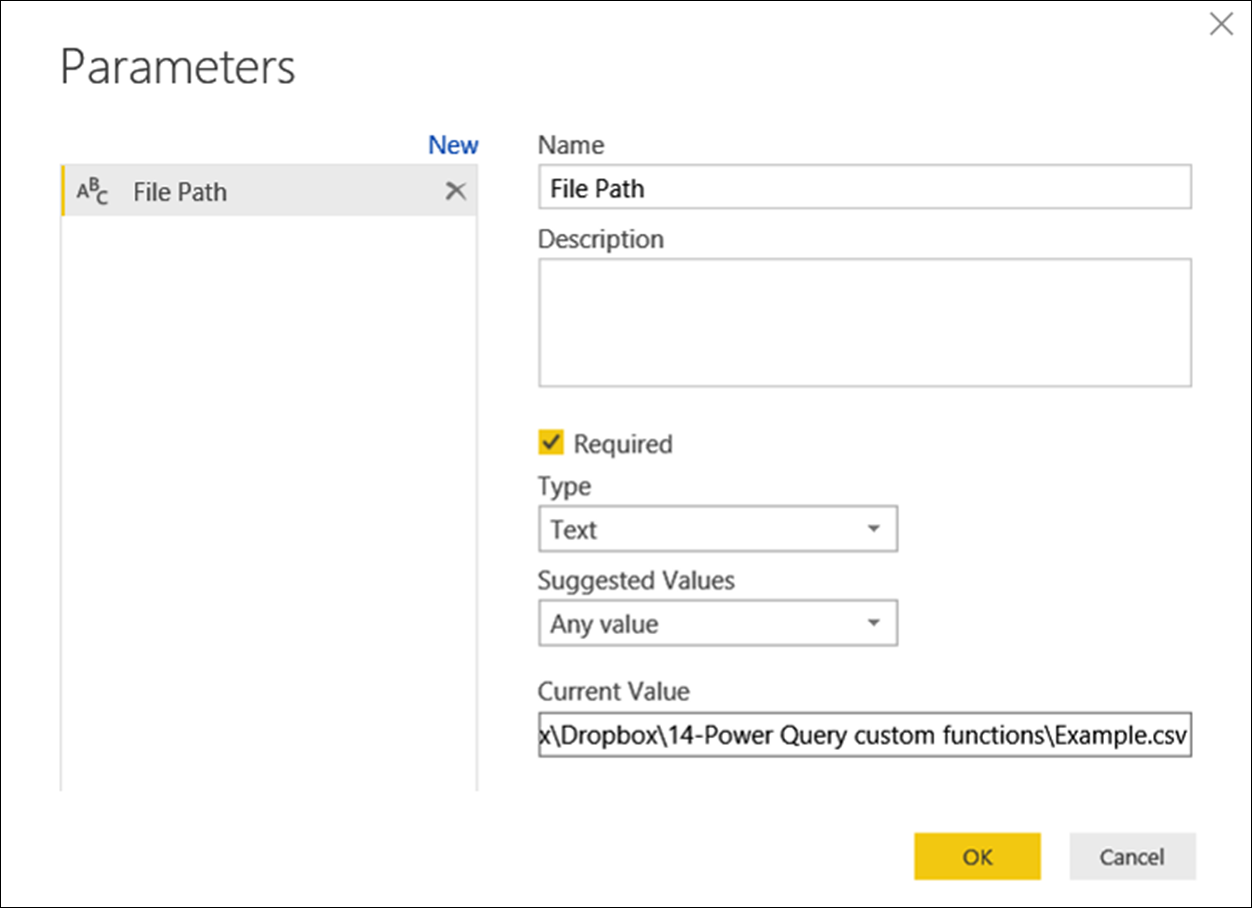
We click Home > Parameters > Manage Parameters > New Parameter. Enter the name “File Path”; set the Type to Text; leave the Suggested Values set to Any Value; and paste in the file path of the “Example.csv” on your own system into the Current Value field.
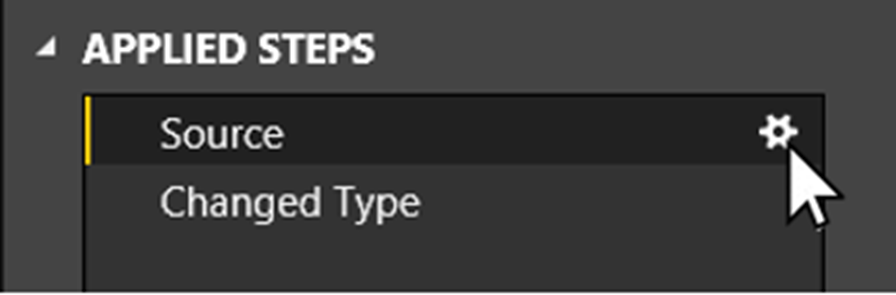
Now we need to associate our new parameter with the “Example” query, replacing the static, literal path. We can do this visually, by highlighting the “Example” query and, in the Applied Steps pane, clicking on the settings button (the cog icon) next to the Source step.
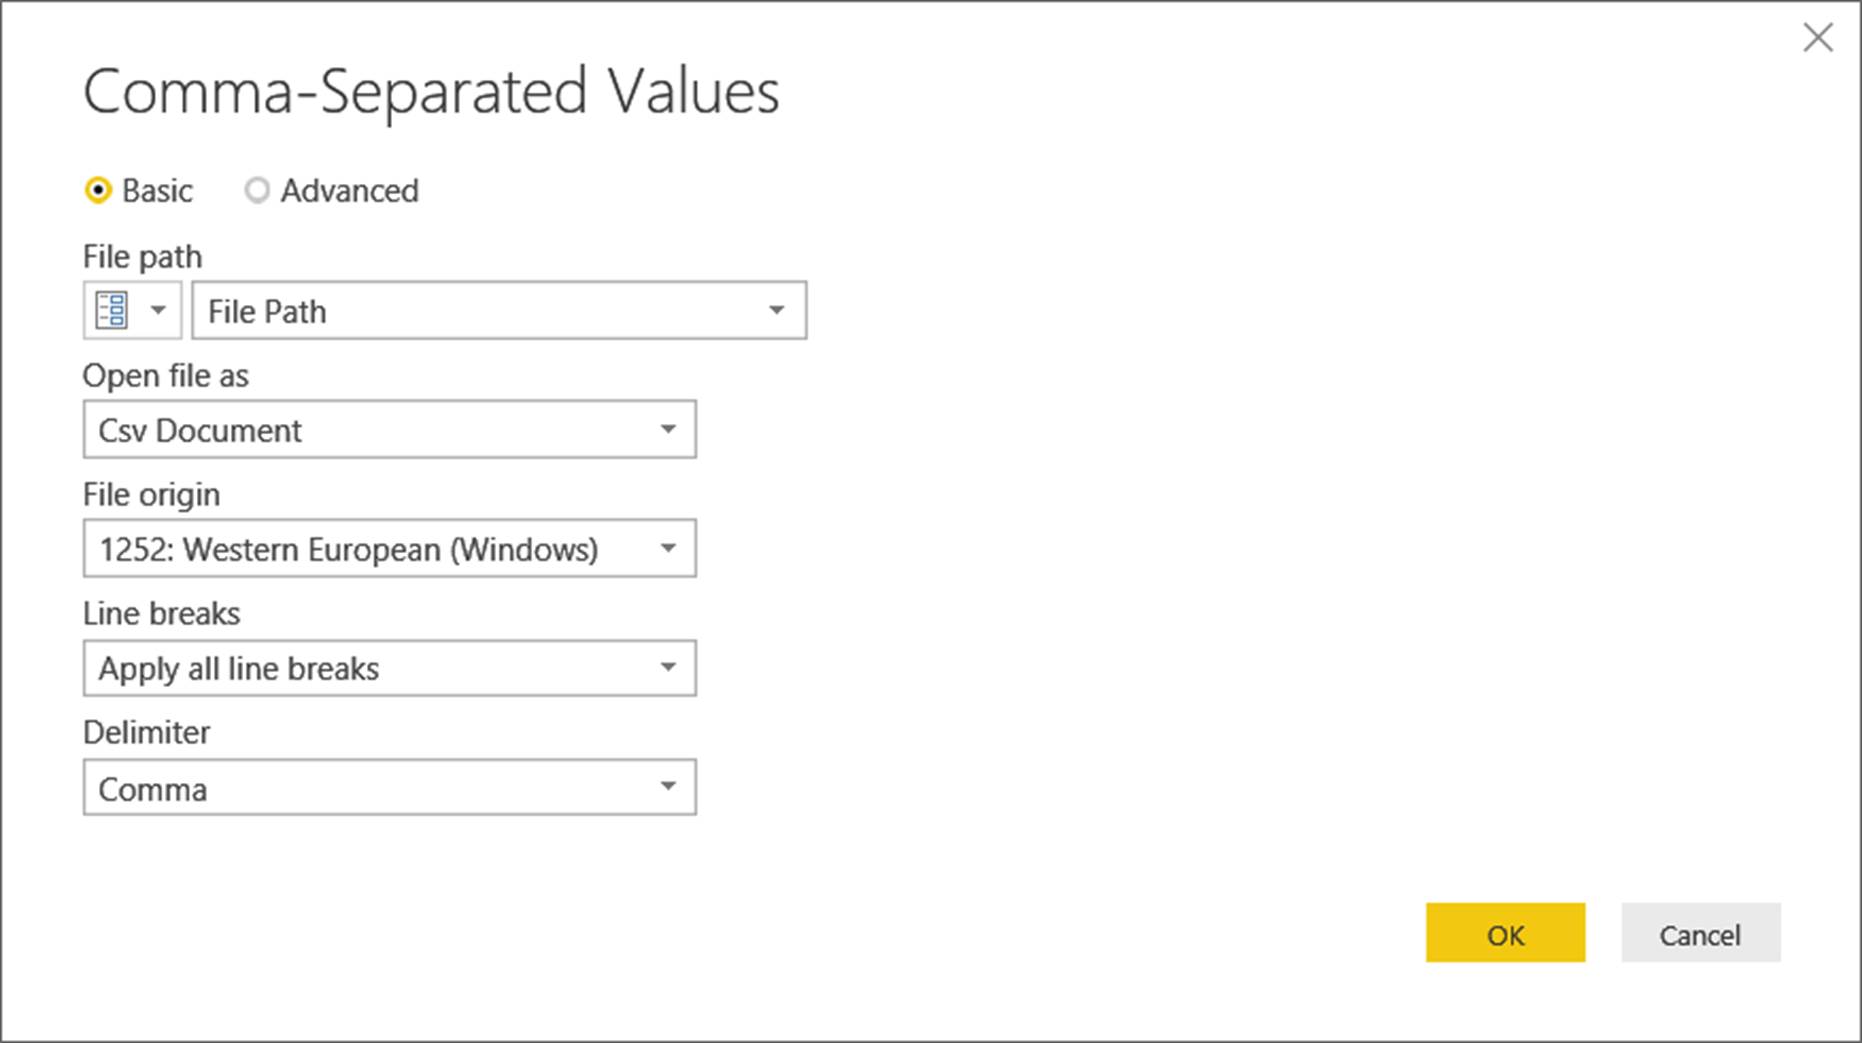
When the Comma-Separated dialog appears, choose Parameter from the File path drop-down.
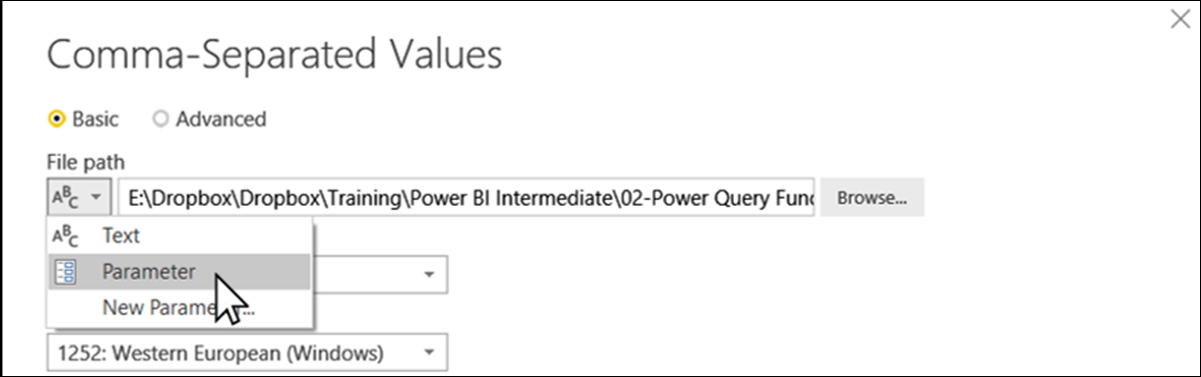
Since we have only created one parameter, called “File Path”, it will be automatically selected; so, just click OK.
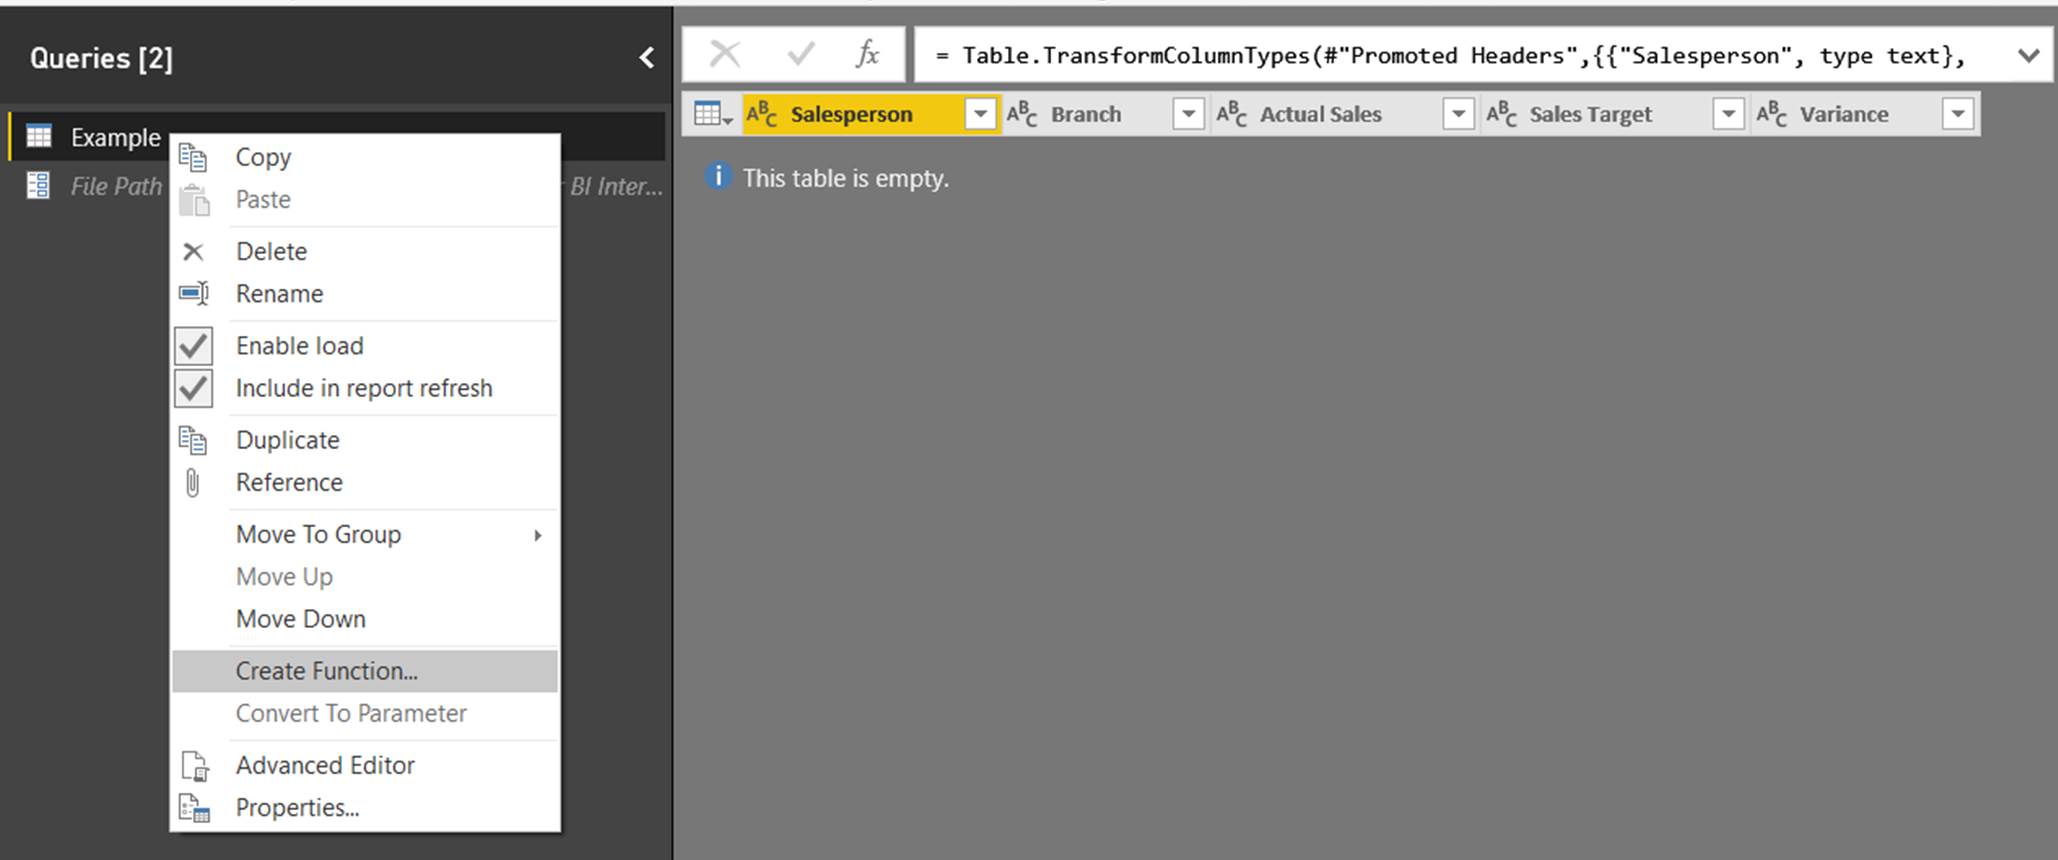
Now that we have associated a parameter with the “Example” query, we can convert it to a function. To do this, right click on the query and choose Create Function from the context menu.
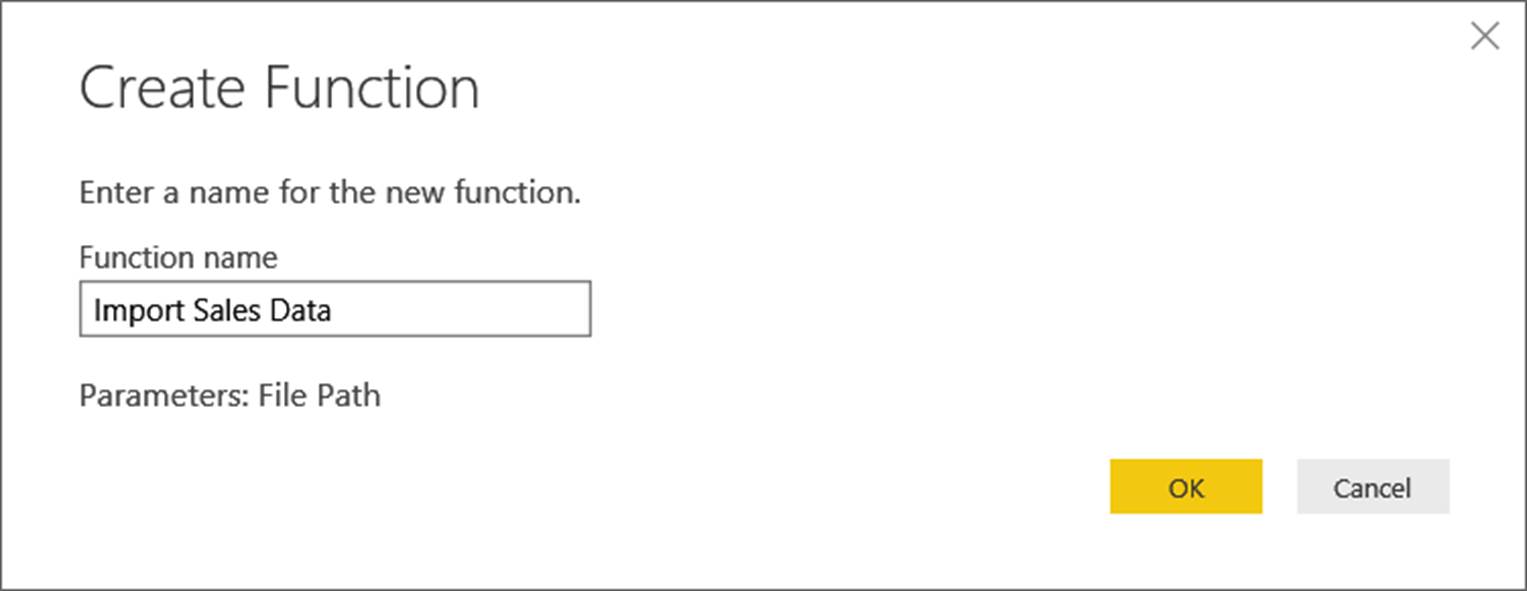
When the Create Function dialog appears, we will name the function “Import Sales Data” and click OK.
In the Queries pane, on the left of the Query Editor interface, Power BI creates a group (a folder) called “Import Sales Data”, the same name as our new function; and places inside it the “Example” query, the “File Path” parameter and the “Import Sales Data” function.
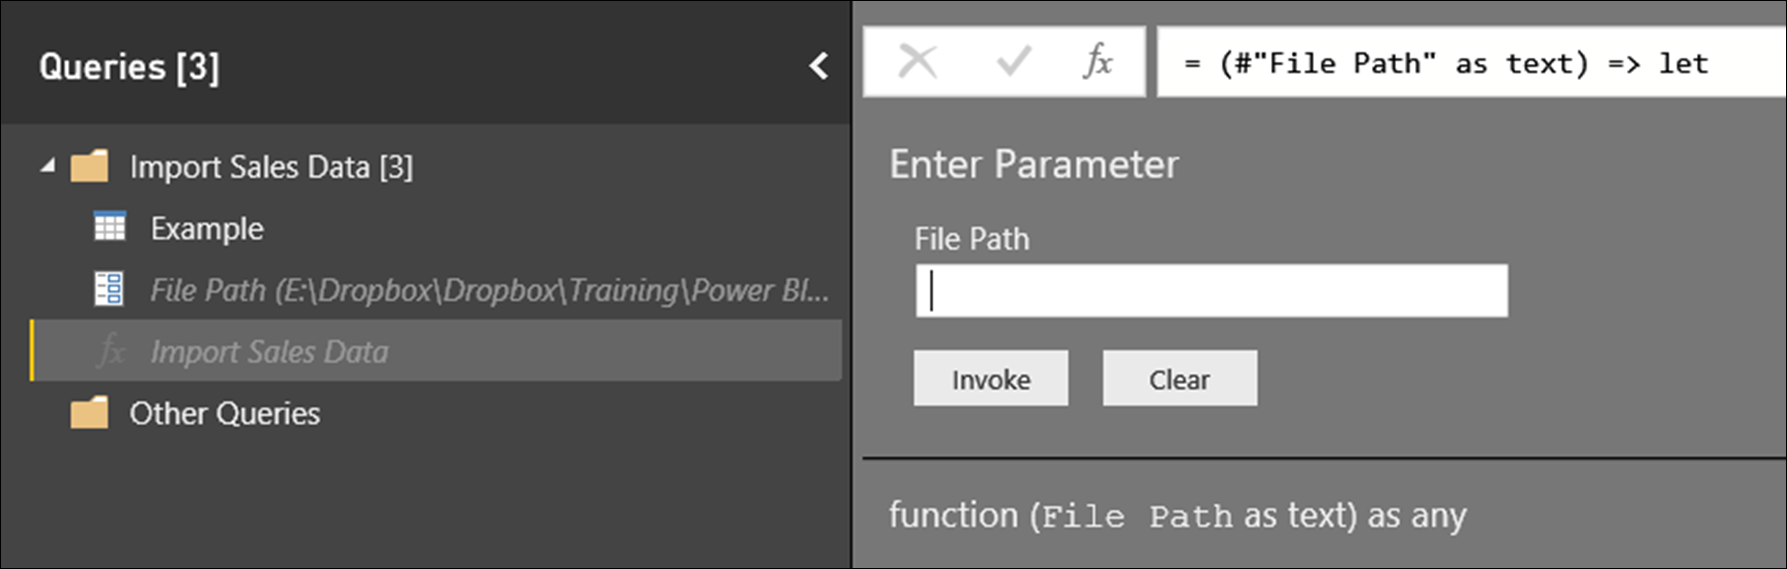
Invoking a Function
The first method of using a function is to `enter a value for each parameter and then click on the Invoke button. Let’s do that.
We navigate to the “Files in List” folder and copy the full path to the file “Birmingham.csv”; paste into the Enter Parameter > File Path field; and click the Invoke button.
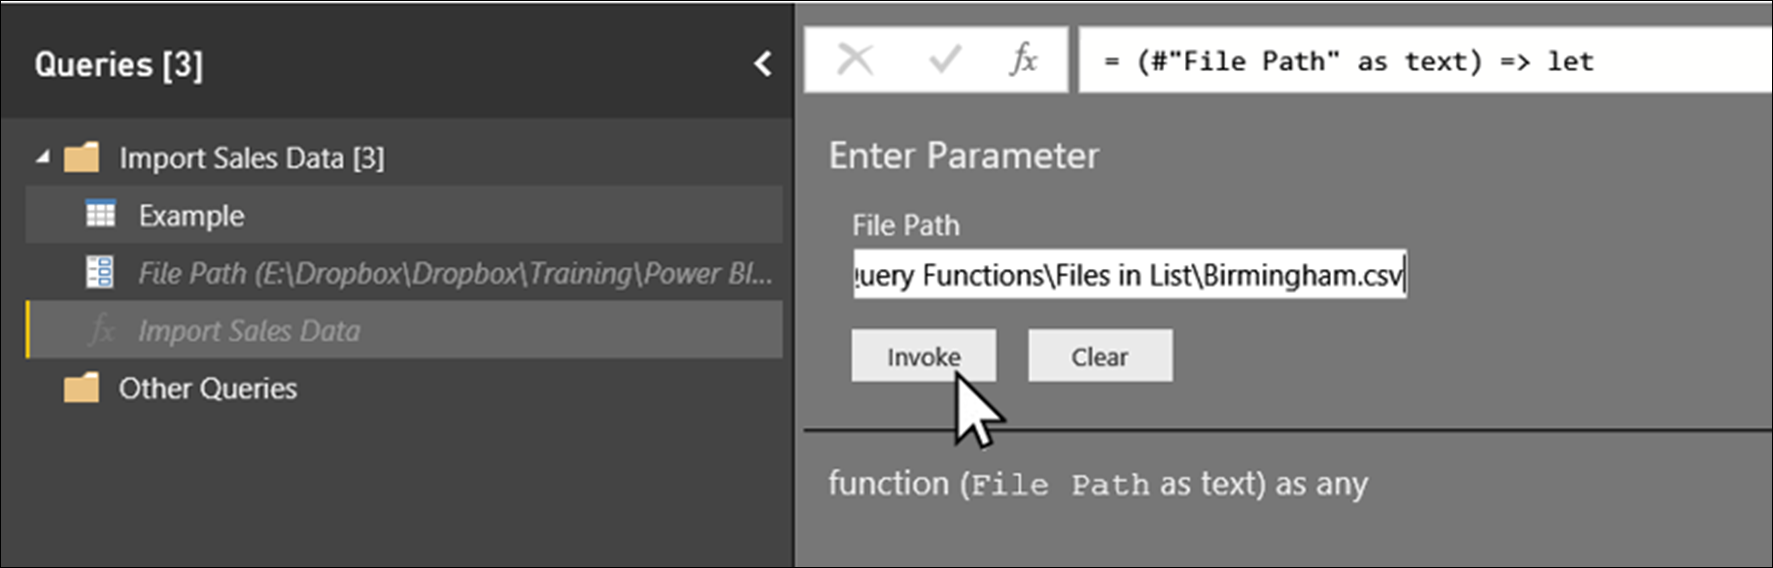
Power BI now creates a new query called “Invoked Function” which is the result of the applying the steps in the function to the file at the location which we entered as the function parameter. Since this file contains data, the “Invoked Function” query retrieves this data.
Invoking a function in this way is useful for testing purposes; but, in this example, it would not save us much time. To combine all the files, we would have to invoke the function repeatedly and then combine the resulting queries using the Append Queries command.
Fortunately, Power BI provides a far more powerful way of deploying our function: the Invoke Custom Function command.
Using the Invoke Custom Function Command
The Invoke function command allows us to apply a function using the values in one of the columns of a table as the input for a function parameter. The function is applied to each row of the specified column; and the results of the function are stored in a new column which may consist of binary information such as tables.
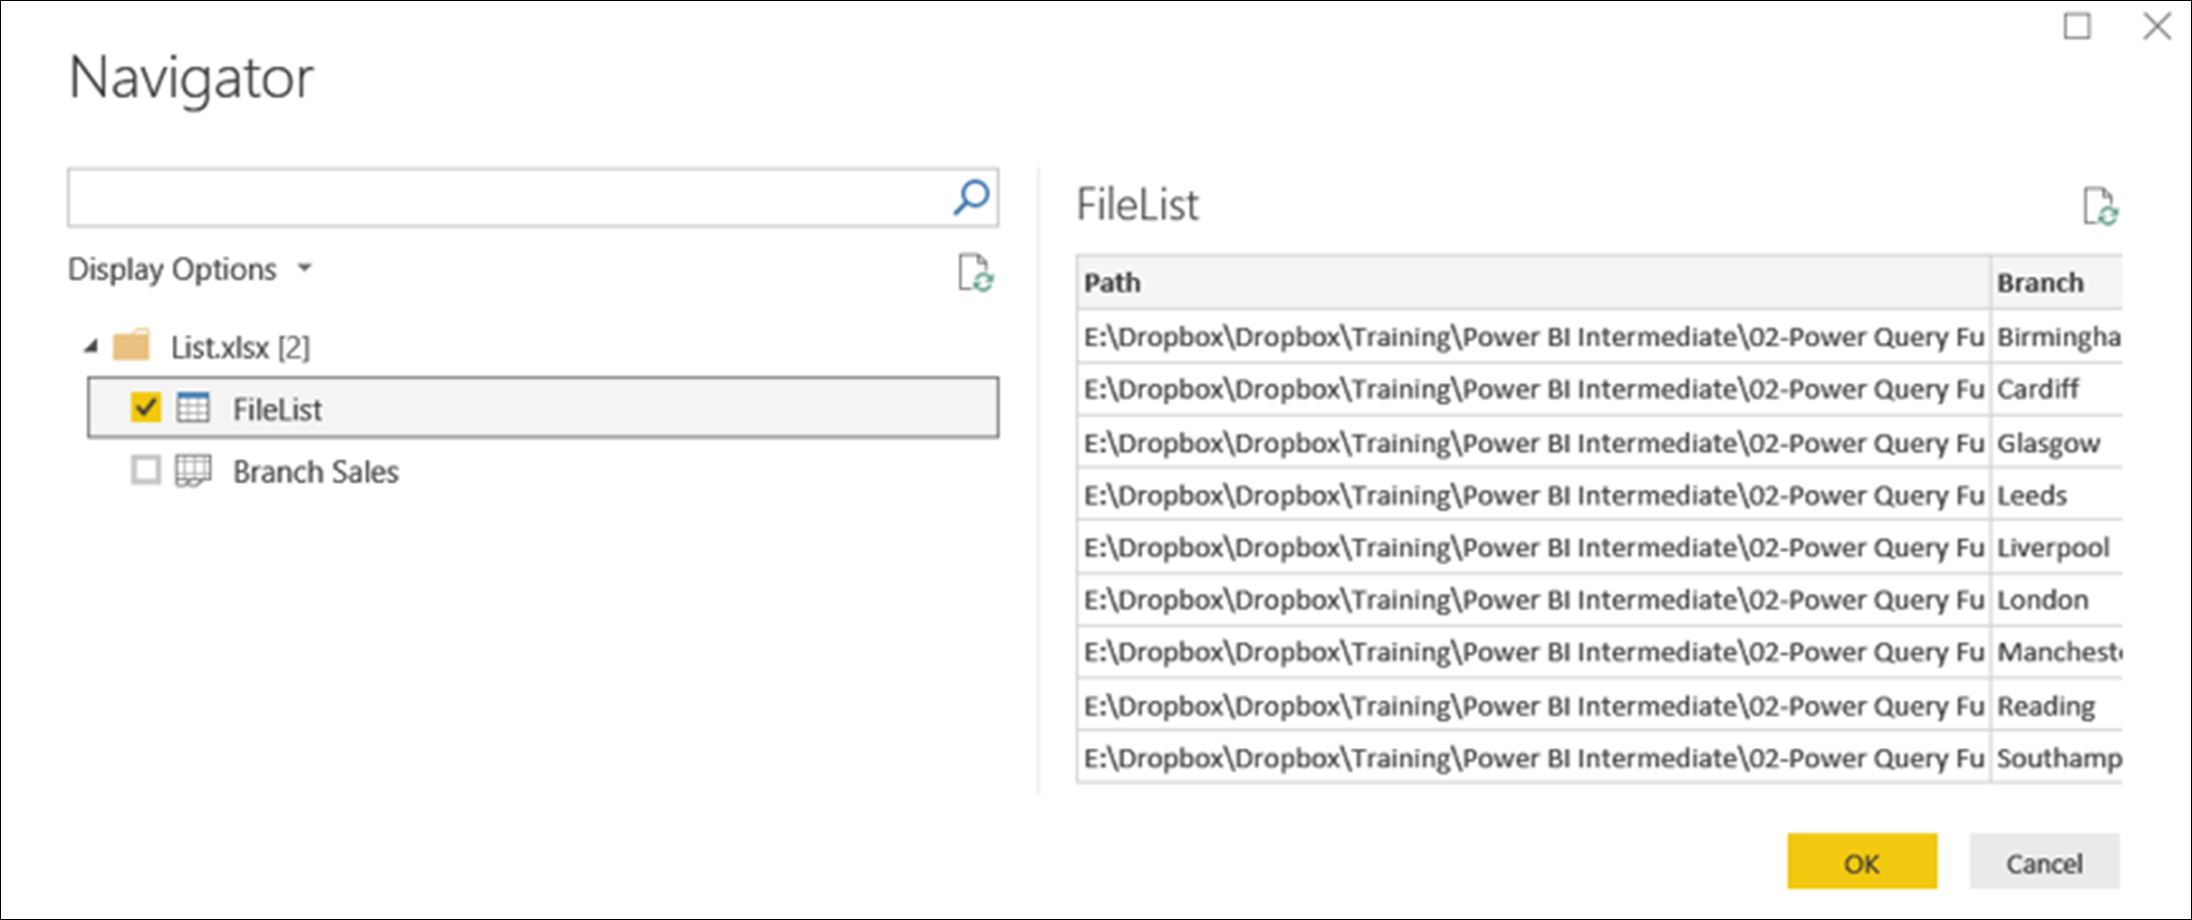
So, let us now delete the unwanted “Invoked Function” query and import the file called “List.xlsx” in the “02-Power Query Functions” folder. (Home > New Query > New Source > Excel.) When the Navigator dialog appears, we click on the checkbox next to the table called “FileList” and click OK.
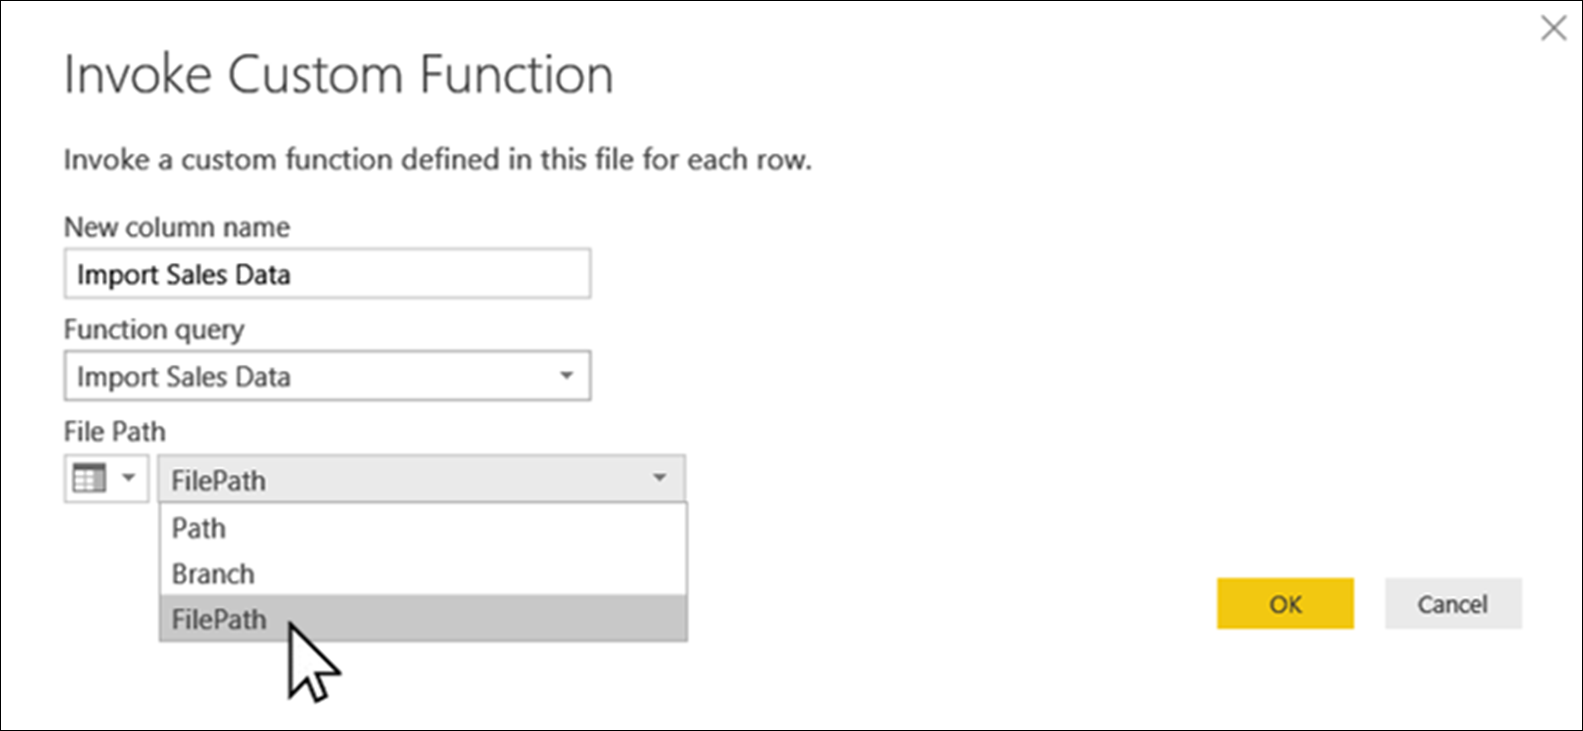
Next, we click Add Column > General > Invoke Custom Column. In the Invoke Custom Column dialog, leave the default column name in place. Since the “Import Sales Data” function is the only one in our solution, it will automatically be selected as the Function Query option. Below this, the list of function parameters contains only one item: File Path. Next to this we have a drop-down containing a list of all the columns in the FileList table; choose FilePath from the list then click OK.
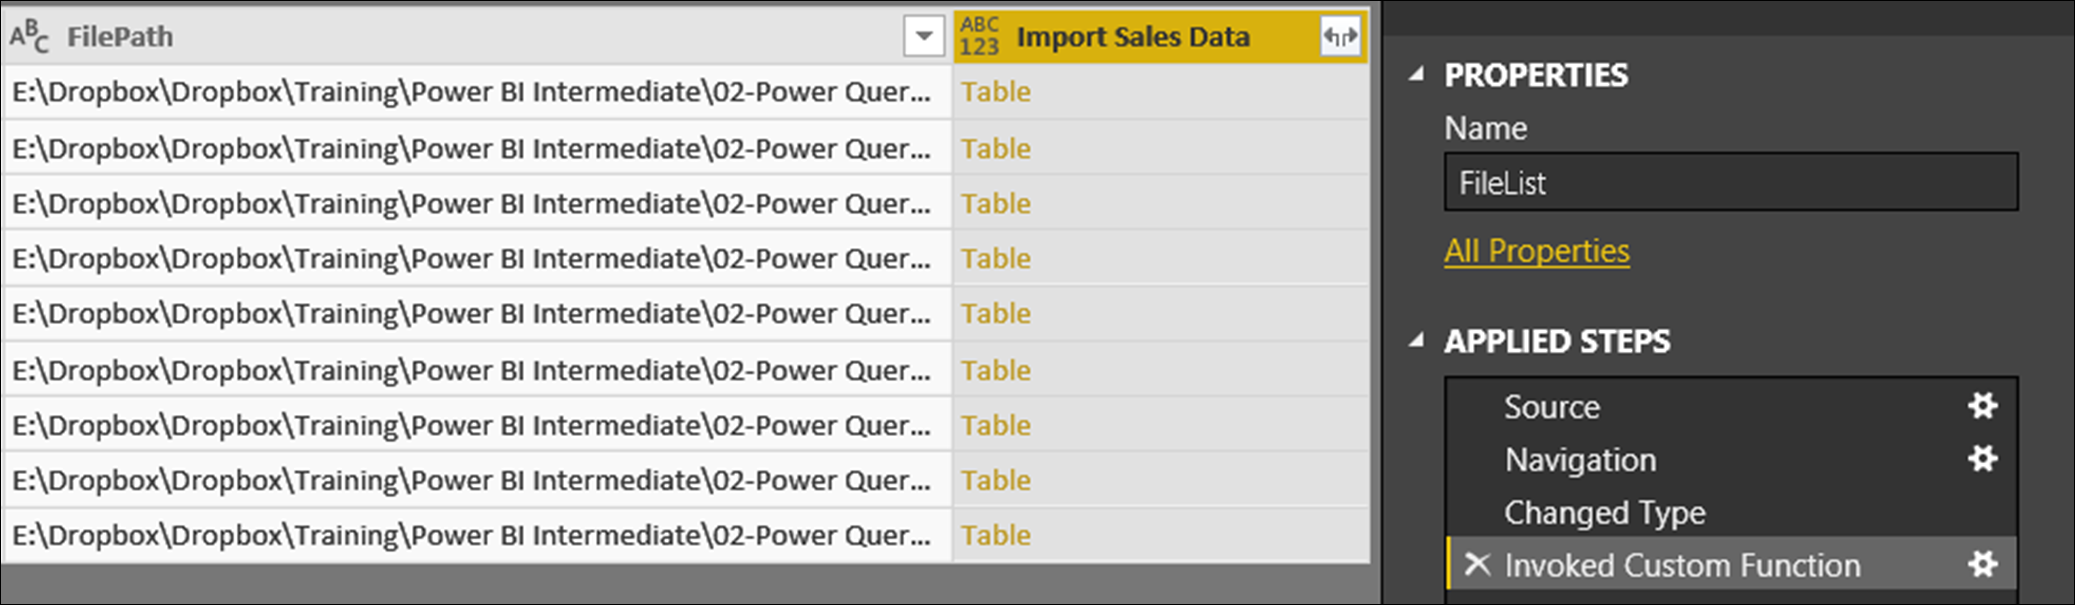
Power BI now creates a new column containing a binary table for each row, based on the value supplied via the FilePath column.
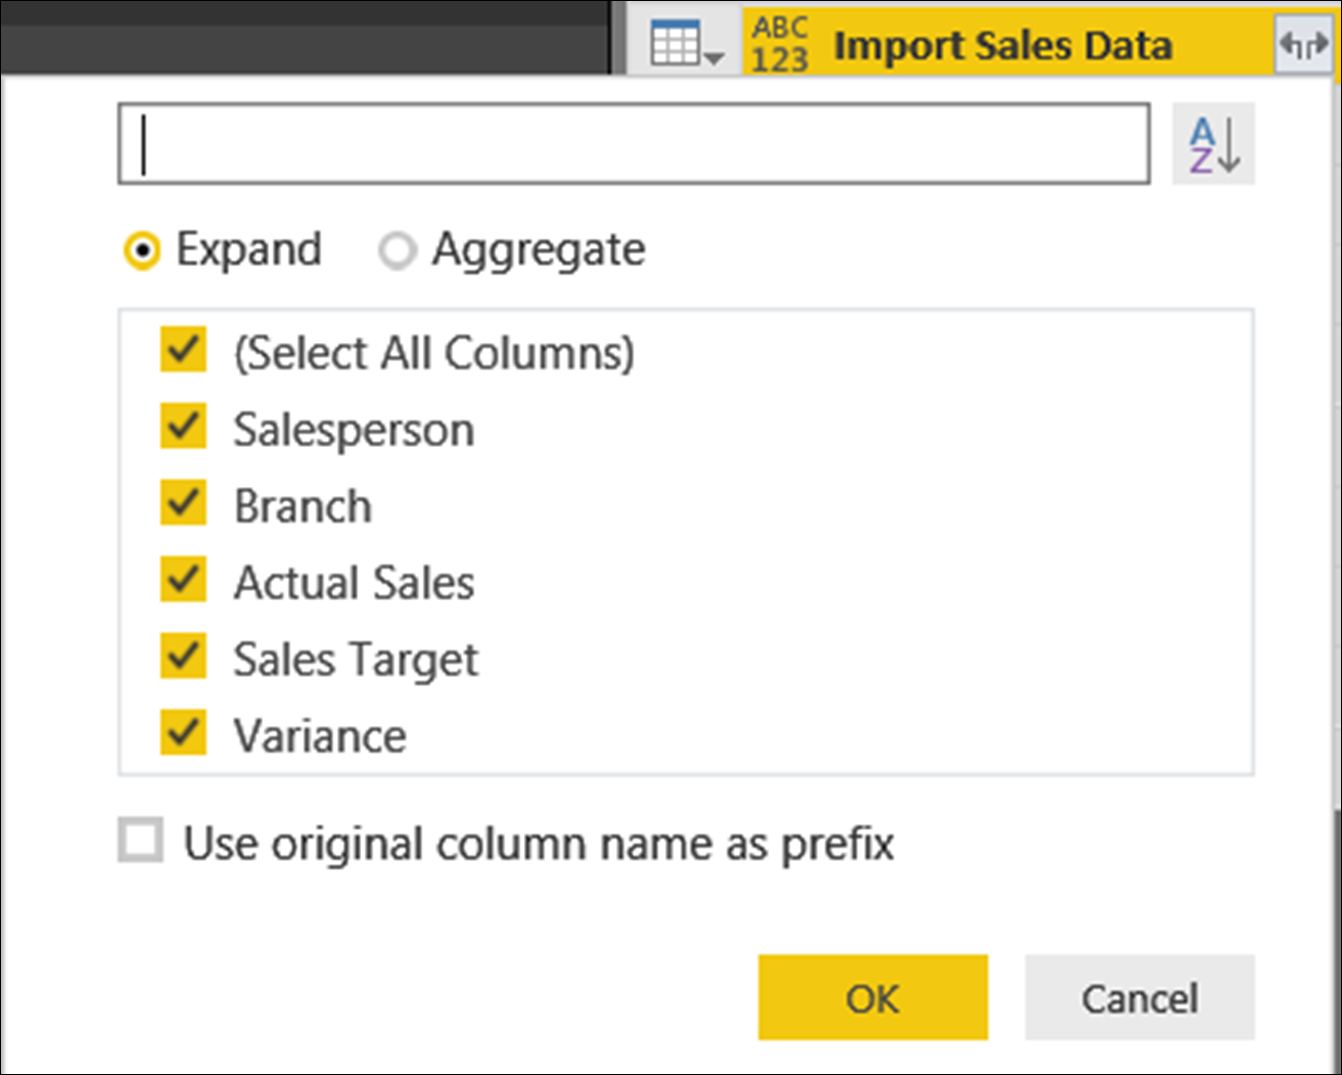
This column is the only one that we now need; so, we can select all the other columns and delete them (Right-click > Remove). Then, all we need to do is to expand this column to combine the tables. Click on the Expand button, on the right of the newly-created Import Sales Data column. When the Expand dialog appears, deactivate the option Use original column name as prefix and click OK.
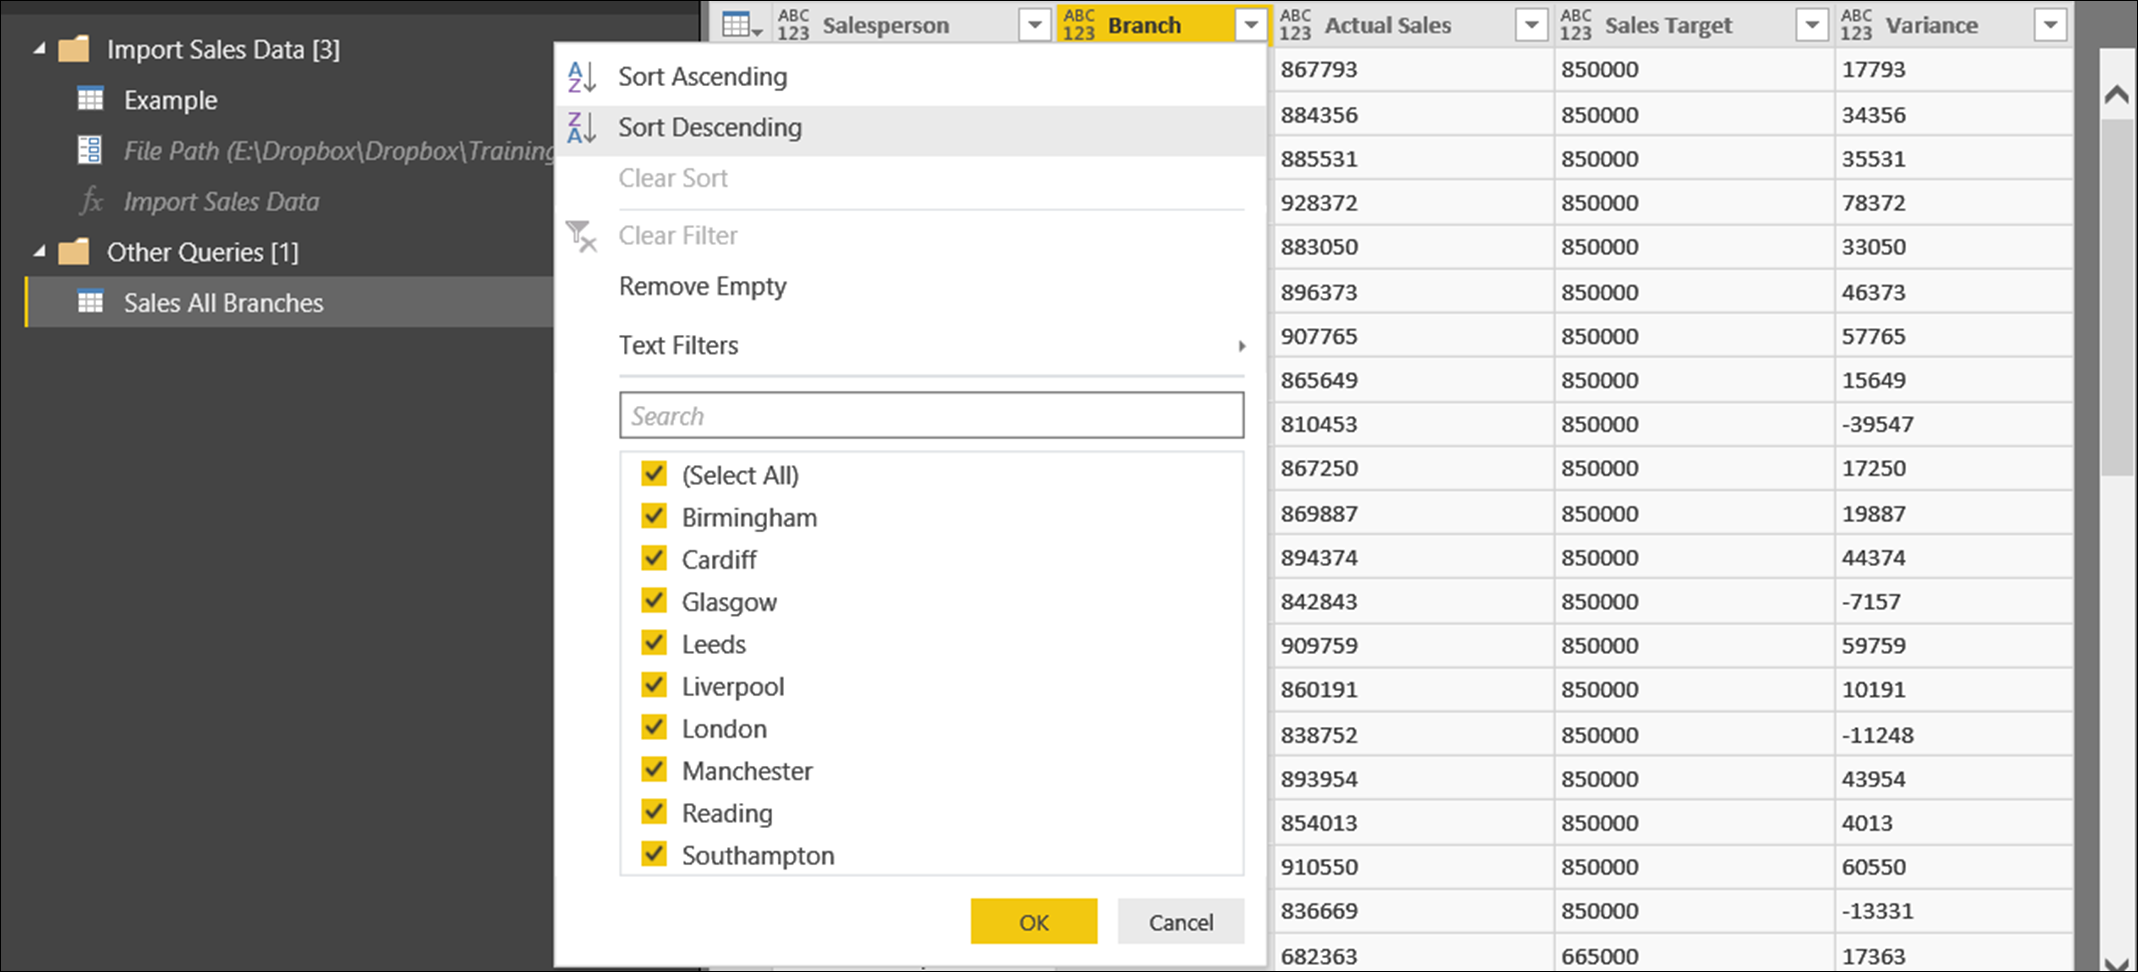
Our “File List” query now expands to include the data in all the files listed in the File Path column. Let us end by renaming the query “Sales All Branches”; and, to verify that the table does, indeed, contain sales data for all branches, click on the filter arrow on the right of the Branch column header.
Understanding Function Syntax
Having looked at creating a function automatically, let us now examine the basic M language syntax for creating a function. To write a function (or any other query) from scratch, in a new Power BI Desktop file, click Home > Get Data > Blank Query. Then, to look at the M code behind the query, click Home > Query > Advanced Editor.
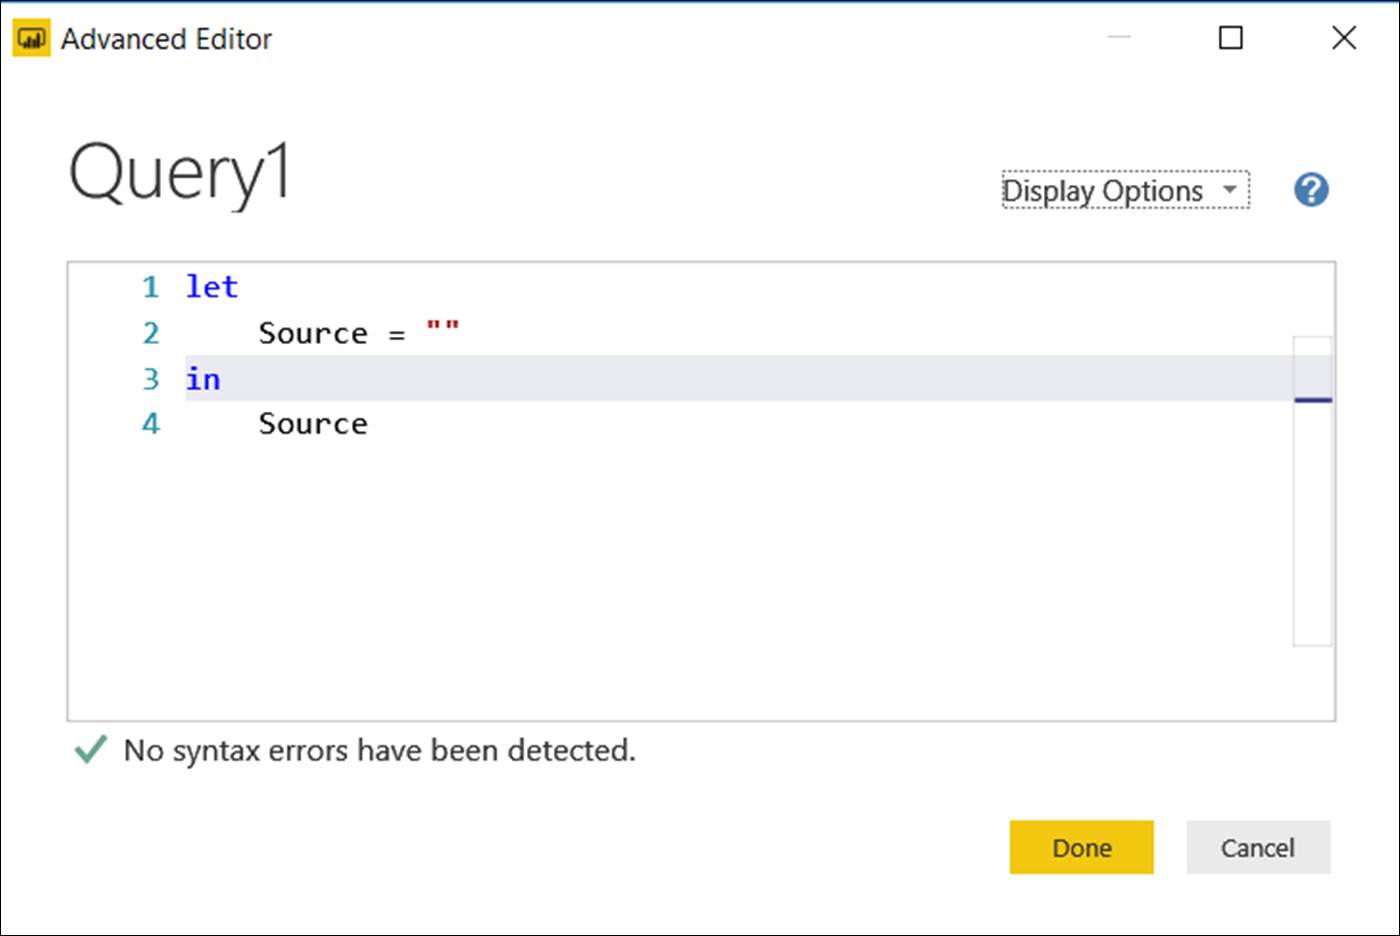
The code you see in the Advanced Editor window consists of a let … in statement block; the classic M structure used in most queries. This code block can contain a series of statements with the following basic structure:
Variable1 = Expression
Variable2 = Expression
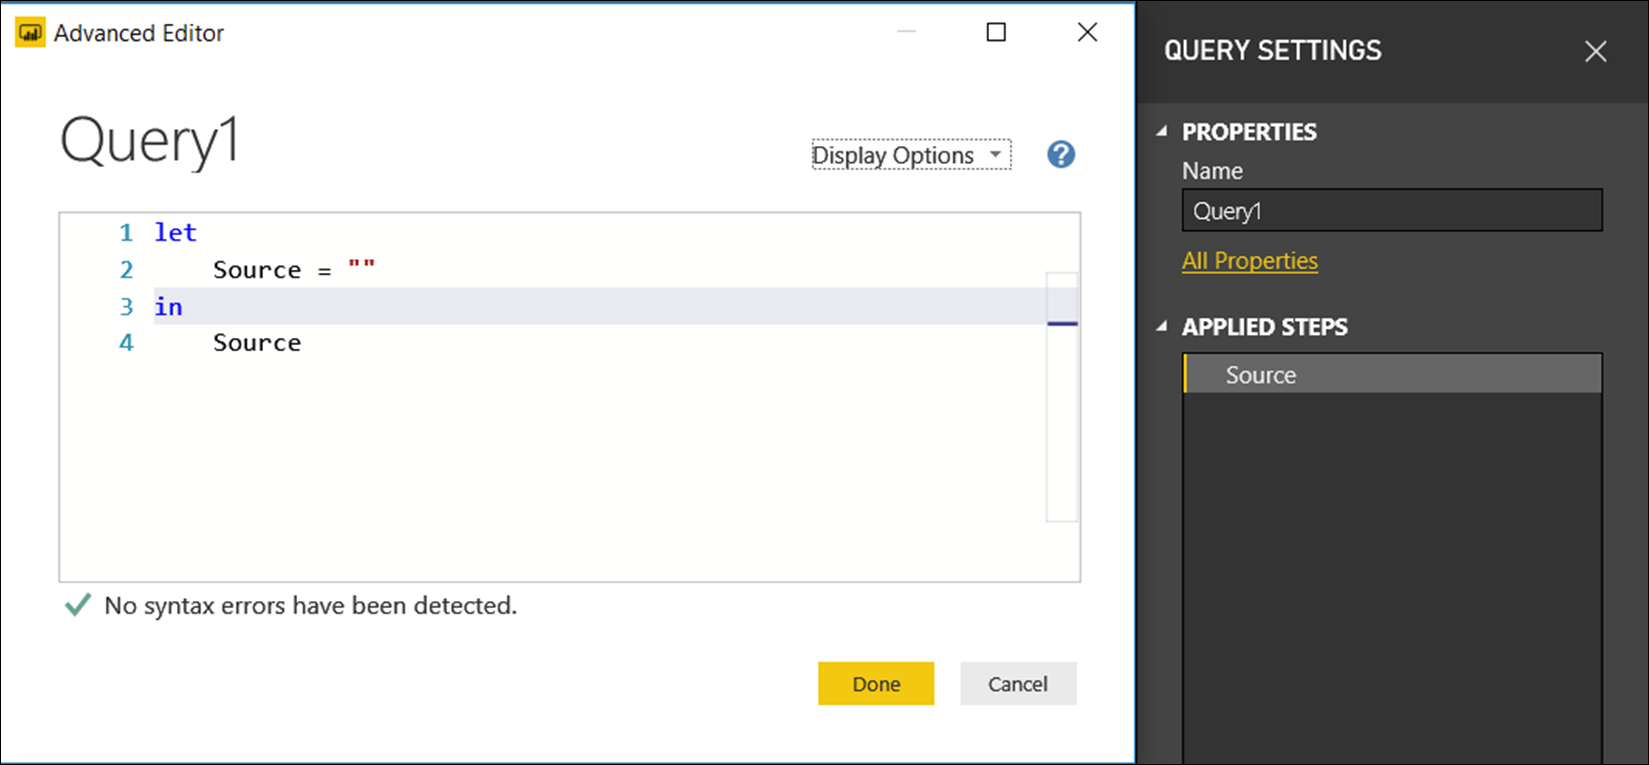
The variable names appear as named steps in the Applied Steps pane. Thus, even in this skeletal query, we can see how the line
Source = “”
has generated a step called “Source” in the Applied Steps pane.
Each line inside a let block, except for the last, must end with a comma. In the blank query code shown above, there is only one line; so, no comma is required.
The expression referenced by the in statement is returned as the result of the query; and, when we have finished writing our function, will determine the value returned by the function.
The basic syntax of an M function is as follows.
let
MyFunction = (Param1 as ParamType[,…]) as ResultType =>
// Expressions required by function
in
MyFunction
The definition of the function is placed inside a variable (here given the generic name “MyFunction”); then, the in statement is used to return (the result of) that function.
The parameter(s) required by the function as its input(s) are placed inside parentheses followed by the symbol =>.
To specify the data type of each parameter, we use the as keyword. Immediately following the parentheses, we use the as keyword again, in a statement which specifies the data type returned by the function.
Then, we have the expressions required to calculate the function result. And, finally, we use the in statement to return a value.