- You are here:
- Home »
- Blog »
- Power BI »
- Power BI Formal and Informal Hierarchies

Power BI Formal and Informal Hierarchies
In this series of blog posts, we will be examining some of the key features of Power BI Desktop, Power Query and the Power BI Service needed to pass exam DA-100: Analyzing Data with Microsoft Power BI.
The series was originally mapped to the MCSA: BI Reporting; however, the topics covered are also relevant to the newer exam DA-100.
In this topic, we will examine the use of business hiearchies in Power BI data modelling and visualization.
Creating Formal and Informal Hierarchies
A hierarchy is a collection of table columns which have a hierarchical relationship between them. An example of a geographical hierarchical, which might be created in a geography dimension table, could be Country > Region > City. Hierarchies can be created in both Power BI and Excel Power Pivot, using very similar techniques.
Creating date hierarchies
In Power BI, by default, whenever a date field is added to a visual, a date hierarchy is automatically created and becomes available for drilldown.
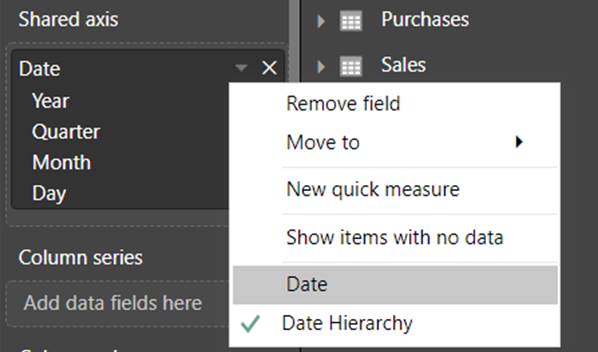
If you do not want this behaviour, you can click on the arrow next to the date field, in the Visualization pane, and choose Date from the context menu. (And you can switch back again by choosing Date Hierarchy from the same menu.)
Options Relating to Automatic Date Hierarchies
However, this behaviour comes at a rather high price. Behind the scenes, Power BI creates a date table to add this hierarchy to every date column in the data model, including those which will never be used as the axis of a visual.
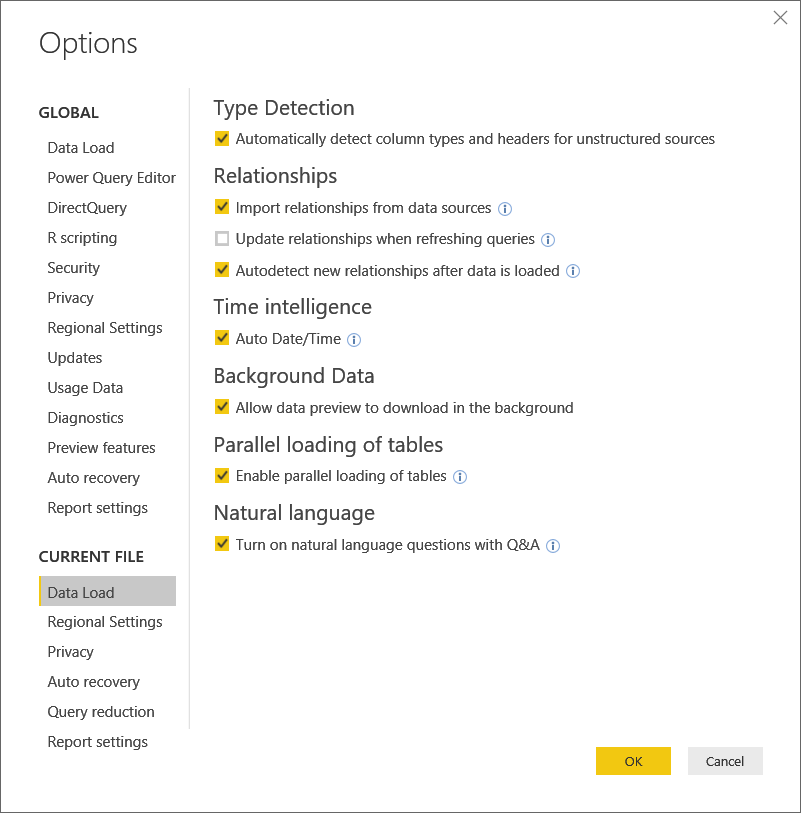
The setting which causes Power BI to automatically create date hierarchies, and the hidden date tables which drive them, can be deactivated by clicking File > Options and Settings > Options > Current File > Data Load > Time Intelligence > Auto Date/Time. When this setting is deactivated, dragging date fields to a visual will not cause Power BI to create date hierarchies; and it will not create the additional date tables necessary to supply this feature.
When Auto Date/Time is active, the date hierarchies created are informal; in that they exist only on the visual. No independent hierarchy object is created. However, by changing the settings, you can have Power BI create an independent and permanent hierarchy in the Fields pane.
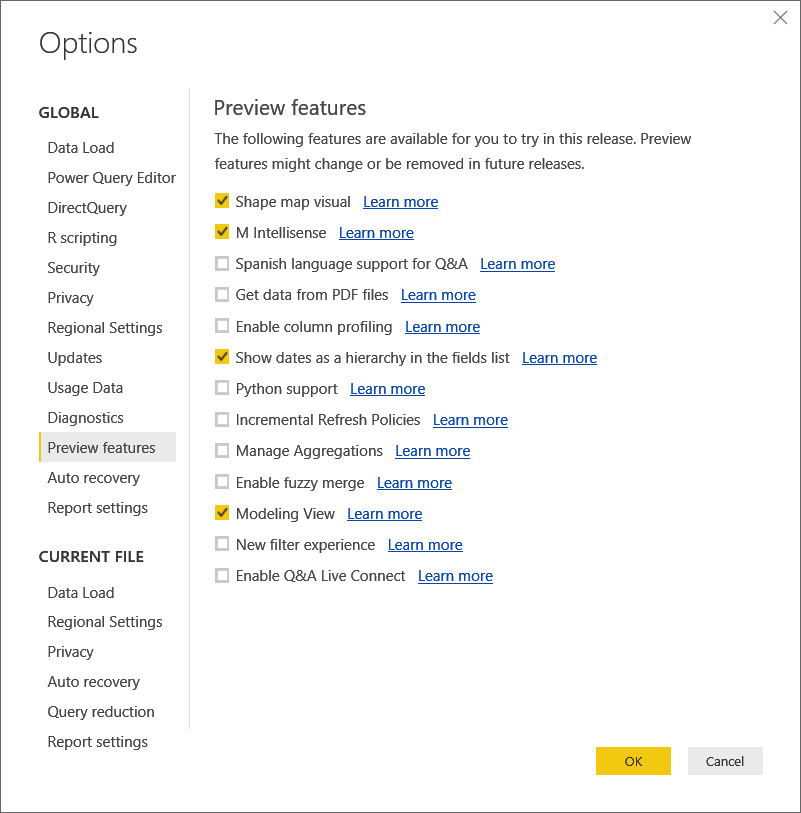
Click File > Options and Settings > Options > Global > Preview Features > Show Dates as a hierarchy in the fields list. (At the time of writing, this option is still a preview feature. When it comes out of preview, it will probably be moved into the Current File > Data Load category; but that is only a best guess.)
Manually Creating a Date Hierarchy in Power BI
However, as we have seen, the automatic creation of date tables constitutes a potential performance overhead; because it causes Power BI to create an extra table for every single date column in the data model. For this reason, you may prefer to turn off the Auto Date/Time feature and create your own date hierarchy.
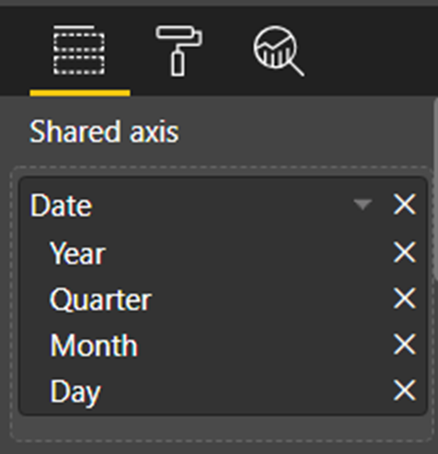
Creating an Informal Date Hierarchy
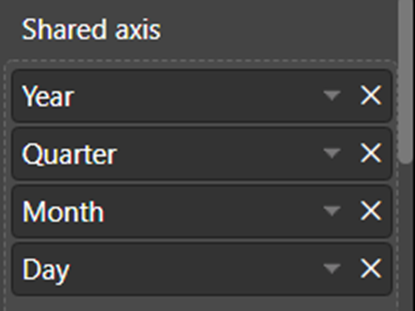
To create an informal hierarchy, simply drag the fields into the desired axis of the visual in the logical hierarchical order; for example: year, quarter, month and day.
However, the next time you wish to add a date hierarchy to a visual, you will have to repeat the same process.
Creating a Formal Date Hierarchy
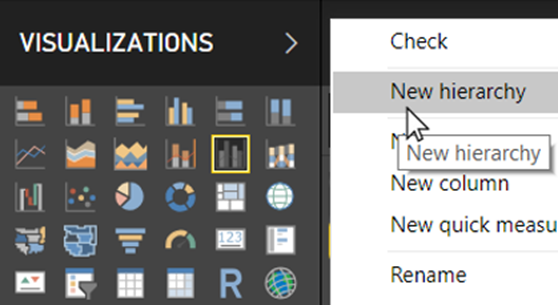
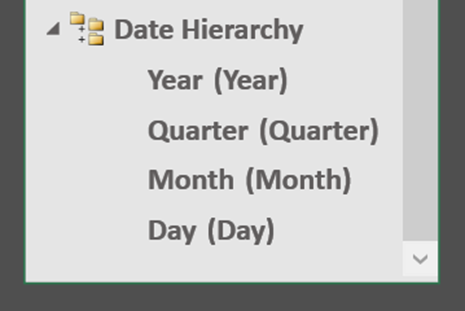
To create a formal and reusable date hierarchy, in the Fields pane, Right-click on the column at the top of the hierarchy (usually the Year Column of your date table) and choose New Hierarchy from the context menu.
This creates a hierarchy containing only the field on which you Right-clicked. To add other items, simply drag each of the relevant fields onto the name of the hierarchy, in the logical order. Finally, rename the hierarchy, as required, by double-clicking the default name.
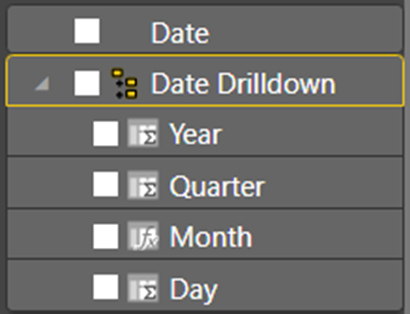
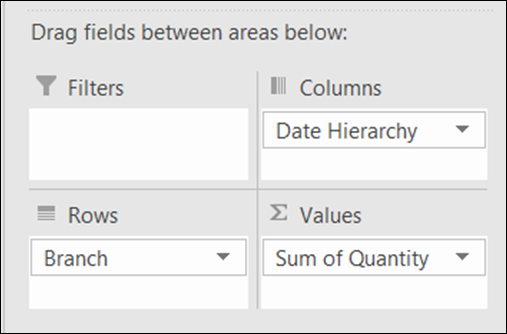
Whenever you need a date hierarchy in a visual, you can now drag the hierarchy object, rather than each of the independent fields.
Creating a Date Hierarchy in Power Pivot
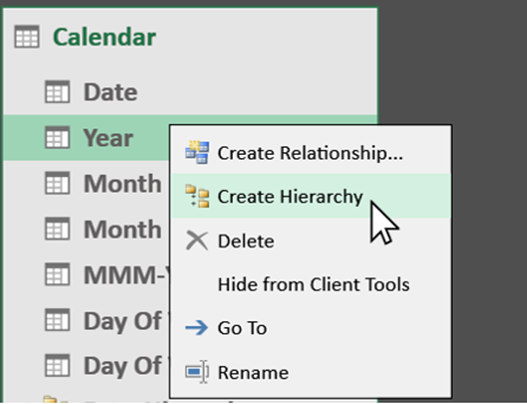
In Power Pivot, there is no such thing as an informal hierarchy. To create a formal and reusable date hierarchy, in the Diagram view, Right-click on the column at the top of the hierarchy (usually the Year Column of your date table) and choose Create Hierarchy from the context menu.
This creates a hierarchy containing only the field on which you Right-clicked. To add other items, simply drag each of the relevant field onto the name of the hierarchy, in the logical order. Then, rename the hierarchy, as required.
Whenever you need a date hierarchy on a pivot table, you can now drag the hierarchy object, rather than each of the independent fields.
Creating Other Business Hierarchies
The simple technique outlined above, for creating hierarchies in Power BI and Power Pivot, can be used to create hierarchies in any dimension tables that contain columns whose relationship is hierarchical.
For example, let us say that our data model contains a Staff table which contains the following hierarchy: Country, Branch, Account Handler. You could create a reusable hierarchy in both Power BI and Power Pivot. In Power BI, you could use it for drilldown on a wide variety of visuals; in Power Pivot, you could place it on the Row or Column axis of a pivot table to enable drilldown.
Creating a Business Hierarchy in Power BI
In Power BI, to create a hierarchy containing columns which reflect a hierarchical business structure, in the Fields pane, Right-click on the column at the top of the hierarchy (in this example, Country) and choose New Hierarchy from the context menu.
This creates a hierarchy containing only the Country field. Next, drag the Branch field onto the name of the hierarchy, followed by the Account Handler field. Finally, rename the hierarchy “Branch Hierarchy”.
Creating a Business Hierarchy in Power Pivot
To create the same hierarchy in Power Pivot, in Diagram view, Right-click on the column at the top of the hierarchy (in this example, Country) and choose Create Hierarchy from the context menu.
This creates a hierarchy containing only the Country field, with the default name highlighted, ready for over typing. Rename the hierarchy “Branch Hierarchy”; then, drag the Branch field onto the name of the hierarchy, followed by the Account Handler field.
You can now use the Branch Hierarchy in the Row or Column axis of pivot tables to facilitate drilldown.
Adding Calculated Columns to Enable Hierarchy Creation
To create a hierarchy, in either Power BI or Power Pivot, all the columns in the hierarchy must be present in the same table. This is usually the case when creating a date hierarchy. However, when creating organizational hierarchies, you may need to combine columns from different dimension tables into the same hierarchy. To do this, you will need to decide which table will house the hierarchy and then ensure that each of the columns is present in that table, recreating columns as necessary.
For example, let us say that, we have a Staff table which contains a hierarchy called “Branch Hierarchy” comprising the following columns: Country, Branch, Account Handler. Now, let us say that we now want to add, to this hierarchy, the client names of each account handler, from a Clients table; and then the product range and product names from a Products table. So, basically, we want to create a single hierarchy; but we want to use columns from three different dimension tables.
In Power BI, we can create an informal hierarchy, using fields from several different dimension tables, by simply dragging the fields into the same axis of a visual in the hierarchical order. However, informal hierarchies can lead to inconsistencies across different reports; so, you may sometimes need to find a way of creating a formal hierarchy containing columns from different tables.
The best solution is to create the hierarchy in the table which has the finest granularity of all the related tables; and this normally means using the fact table. In the example outlined above, Staff, Clients and Products are dimension tables linked Sales which is the fact table. We would therefore create the hierarchy in the Sales table which, of course, means that we must recreate all the columns required by the hierarchy, in the Sales table.
Columns created in this way do not create much of an overhead, since they tend to have a low cardinality; i.e., they have relatively few distinct values.
The RELATED function
The main function used in creating these columns will be the RELATED function. The RELATED function can be used, when creating a calculated column in the table on the many side of a relationship. It takes, as its single argument, a column in the table on the one side of that relationship. Hence, by definition, RELATED will always return a single value.
Syntax
RELATED(
Column
) as scalar value
- Column
The column that contains the value you wish to retrieve.
In our example, we wish to create the following columns in the Sales table: Country, Branch, Account Handler, Customer Name, Product Range and Product. The syntax for doing this would be as follows.
Country = RELATED(Staff[Country])
Branch = RELATED(Staff[Branch])
Account Handler = RELATED(Staff[Account Handler])
Customer Name = RELATED(Clients[Customer Name])
Product Range = RELATED(Products[Product Range])
Product = RELATED(Products[Product])
Having created all the necessary columns, we would use the techniques outlined above to create a hierarchy in the Sales table.
In summary, hierarchies are a useful construct in Power BI visualization, since they assist the creation of drill-down experiences. Informal hierarchies offer the greatest flexibility; however, they must be recreated from scratch each time required. Formal hierarchies provide consistency and re-usability; however, to create them, all the fields in the hierarchy must reside in the same table; which, in turn, often demands the creation of additional calculated columns.