- You are here:
- Home »
- Blog »
- Power BI »
- The DAX DATESINPERIOD Function

The DAX DATESINPERIOD Function
The DAX DATESINPERIOD function is very useful where you want to perform a calculation within a fixed time period, for example, a quarter, a month a year, but always relative to the current period.
We will take two examples of its usage. Firstly, to work out a moving annual total, and secondly, to work out a three-month moving average.
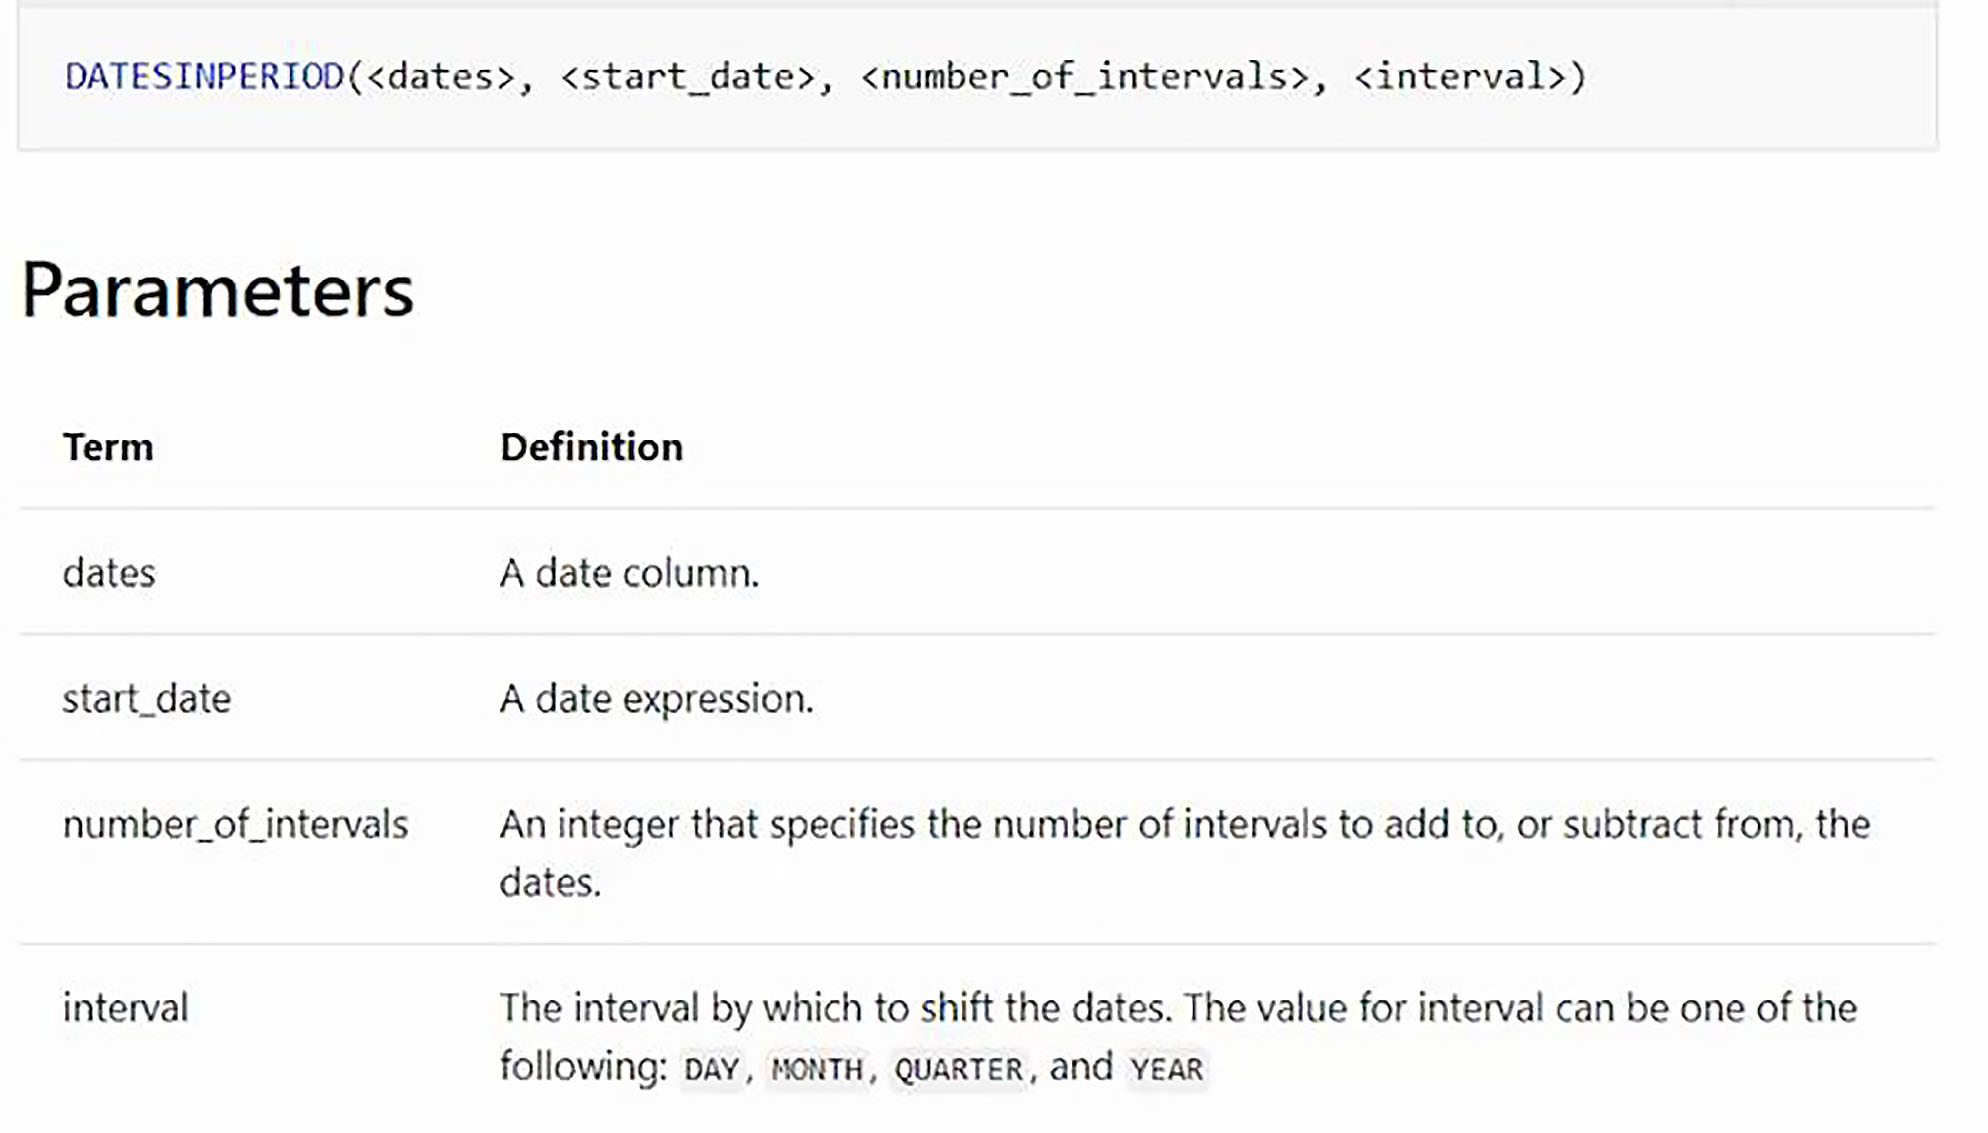
The DATESINPERIOD function takes four arguments.
· The first is the standard Date column, which will be ‘Date Table'[Date].
· The second is the start date. So, if we are looking at a time period, which is in the past, our start date will normally be the last date in the current period. Whereas if we are looking to the future, our start date will be the earliest date in the current period.
· Then the number of intervals, working backward or forward from the start date.
· And finally, the Interval argument specifies the time units that we want to work with: Day, Month, Quarter or Year.
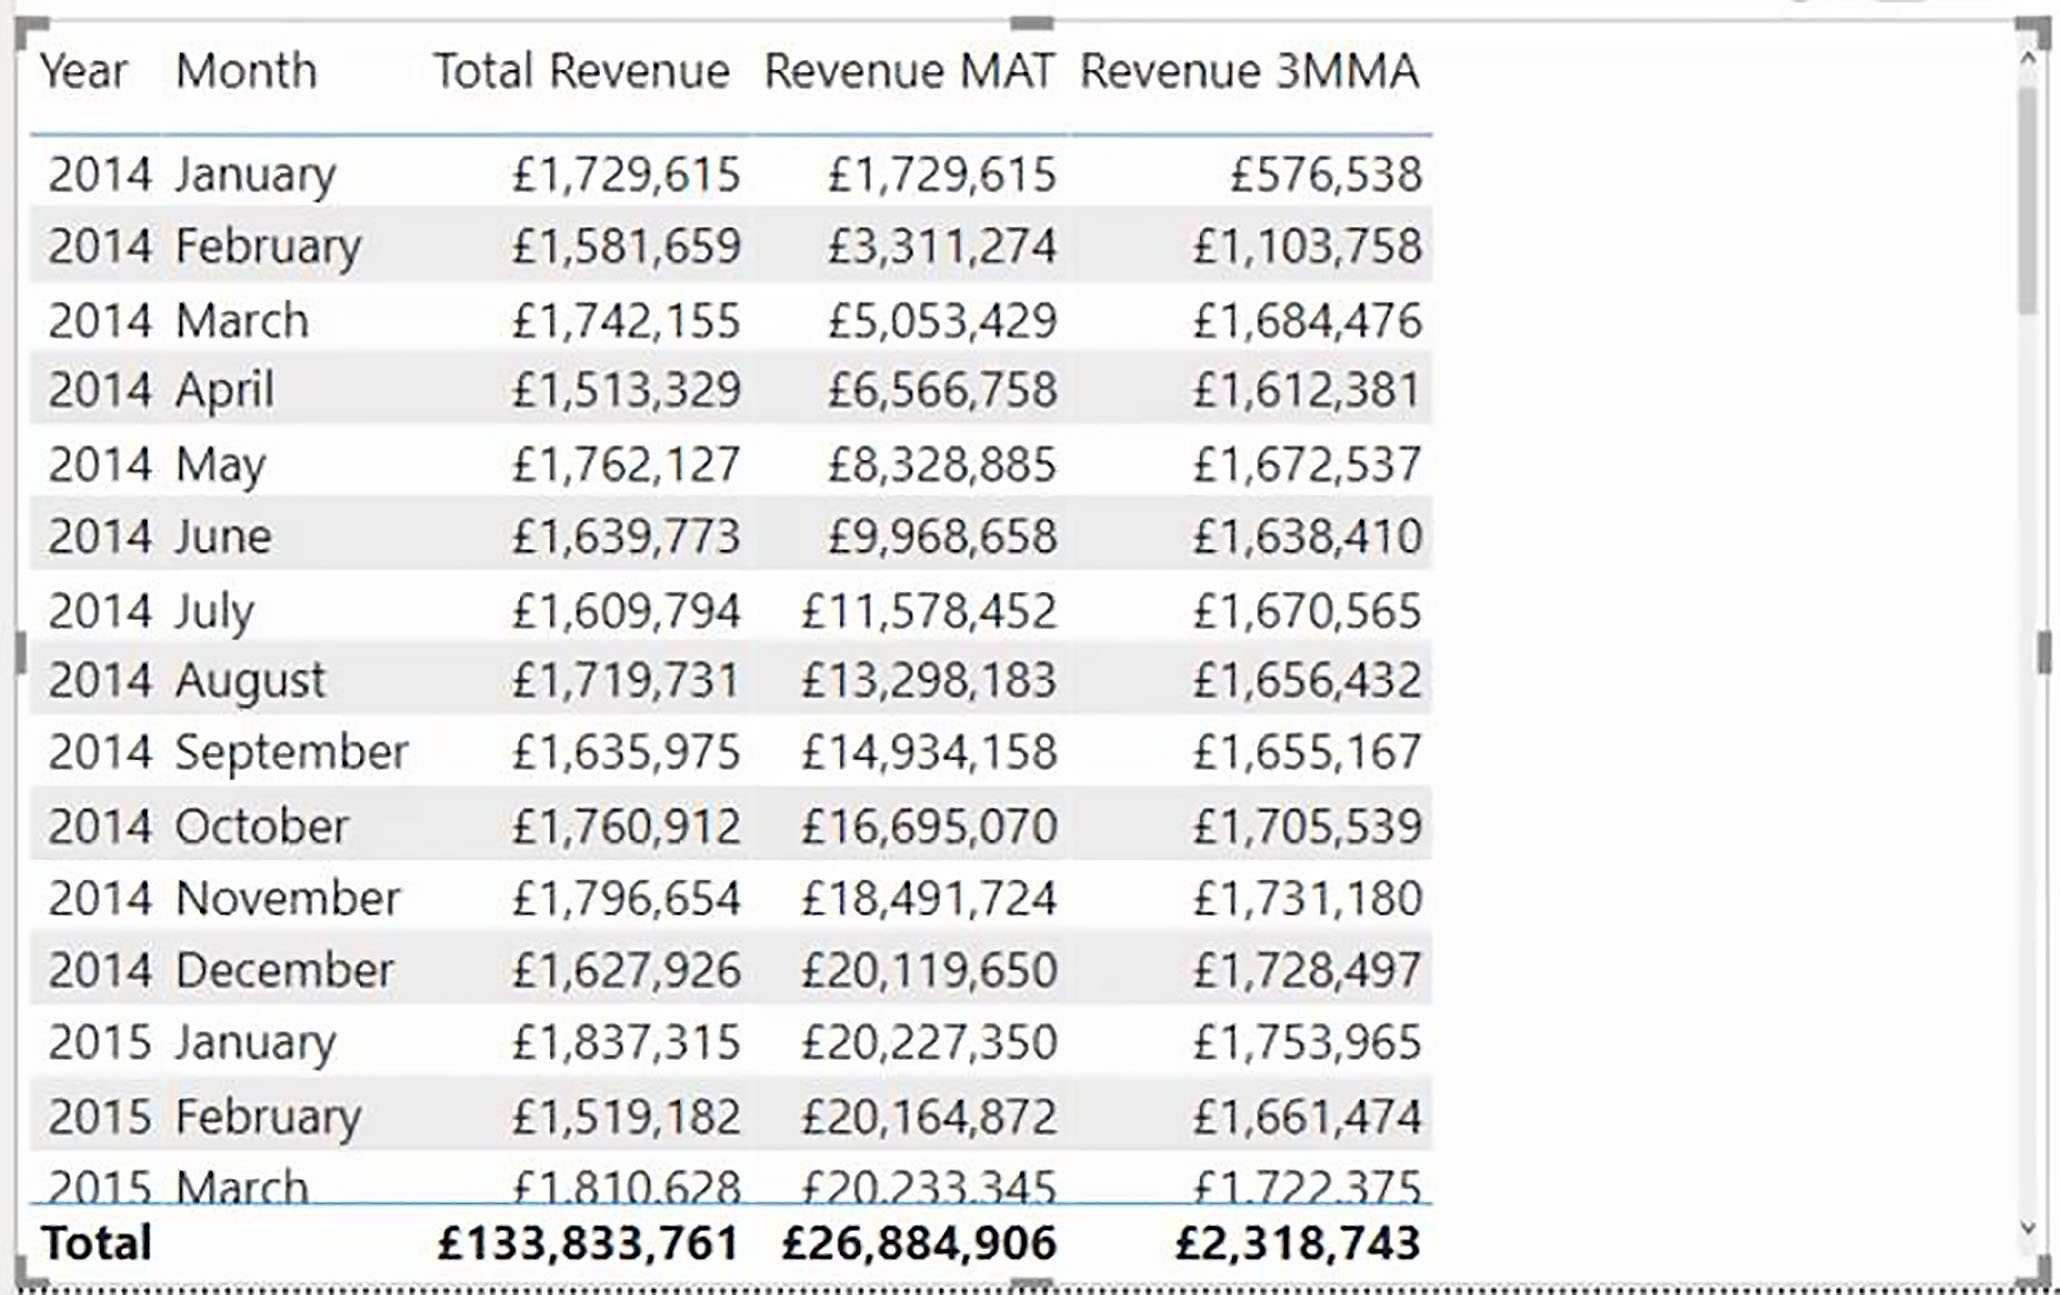
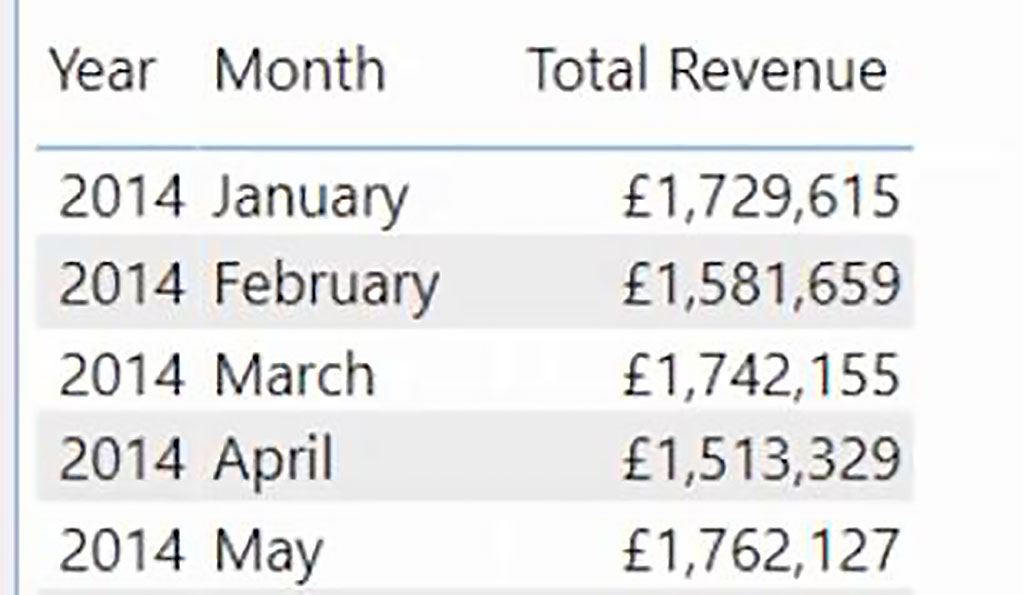
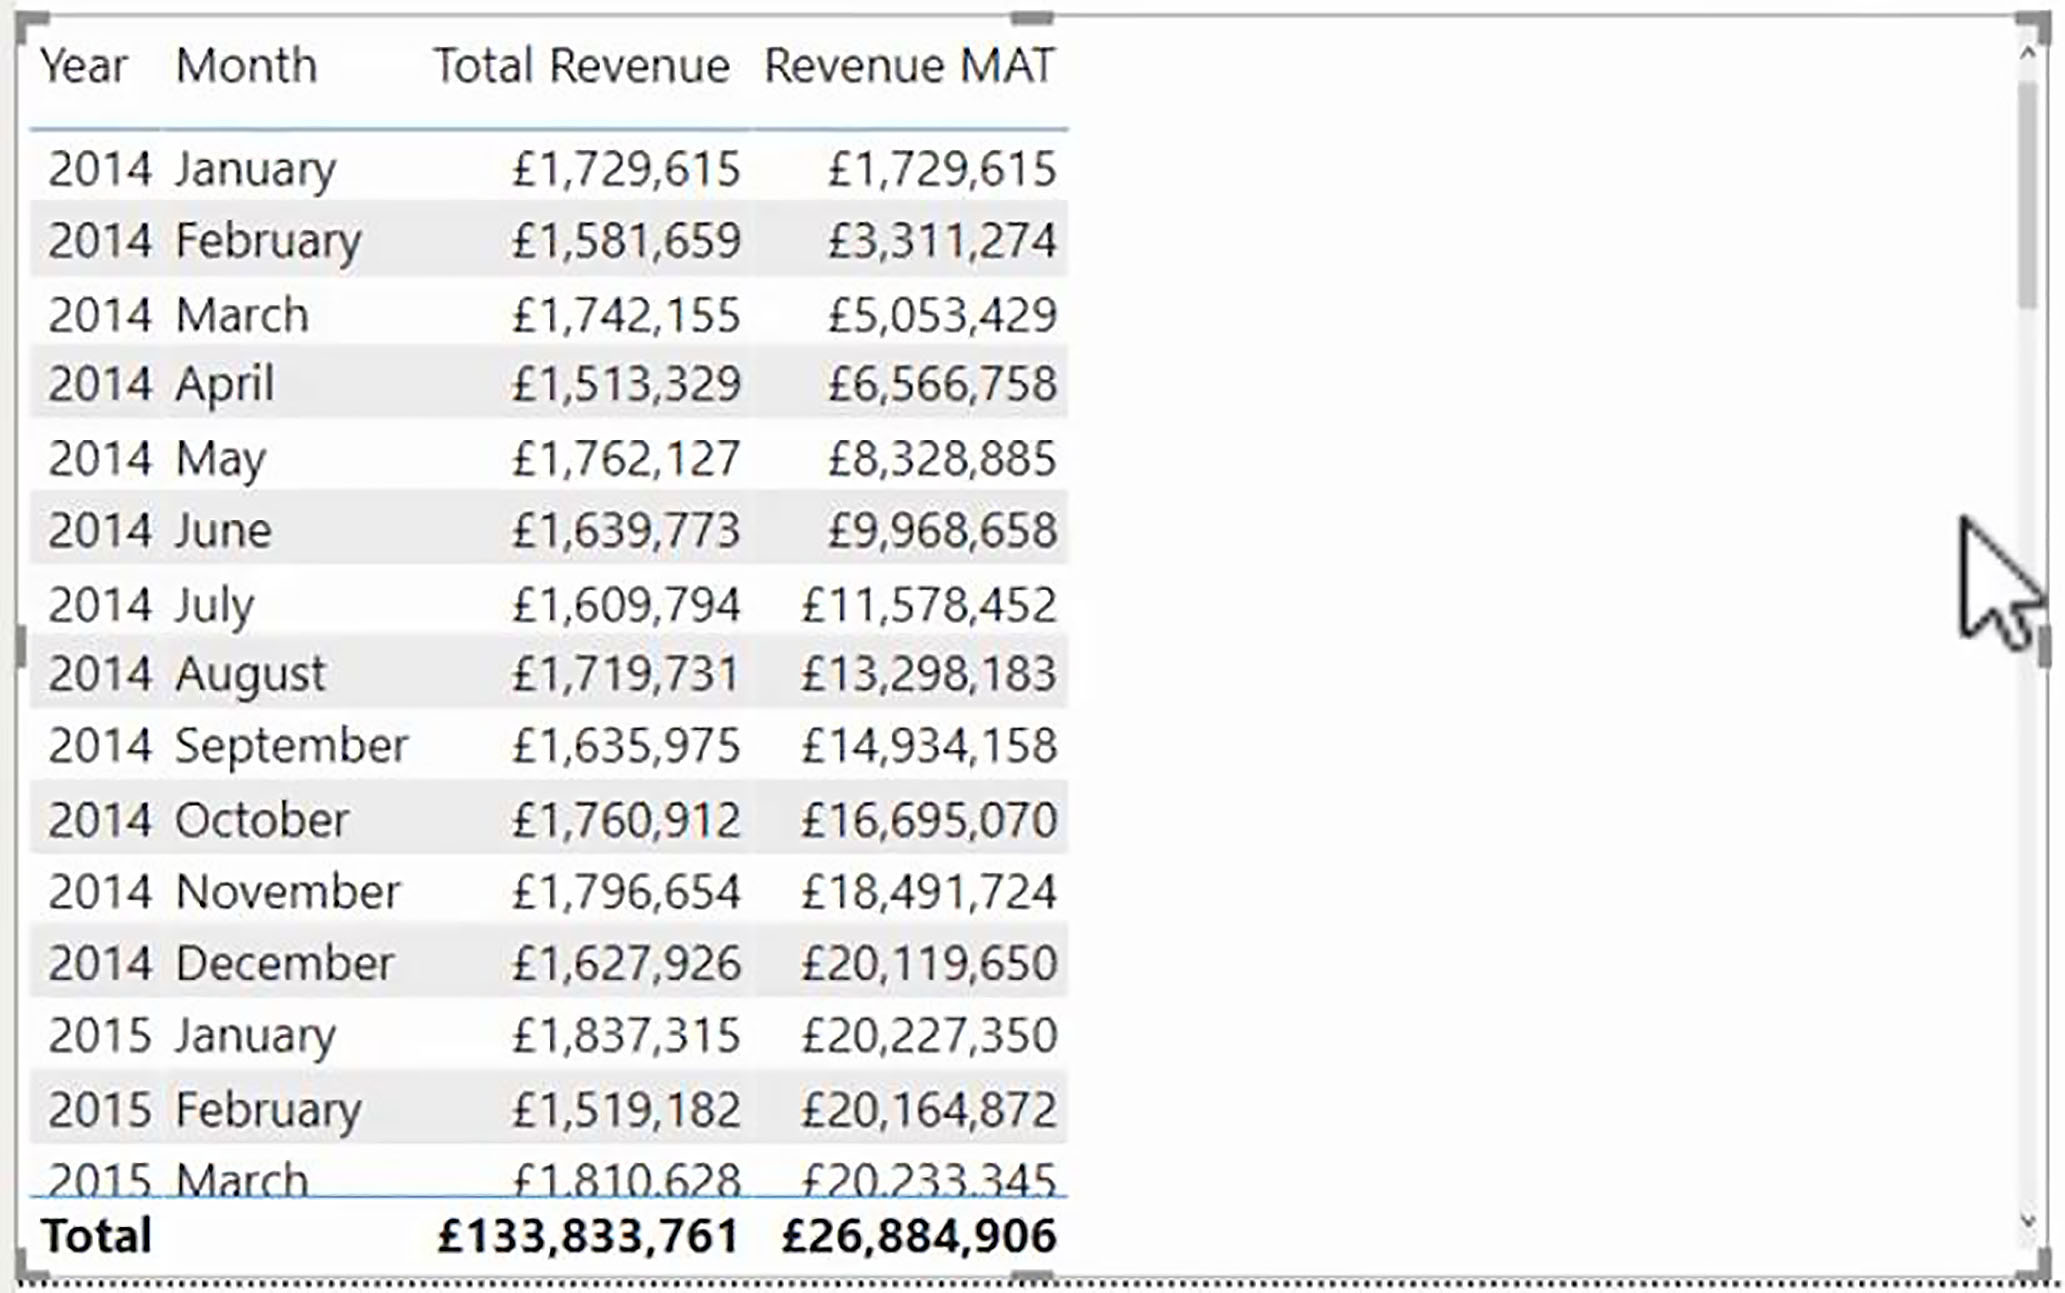
To examine the results produced, we have a table visual displaying the Year, Month and Total Revenue.
Moving Annual Total (MAT)
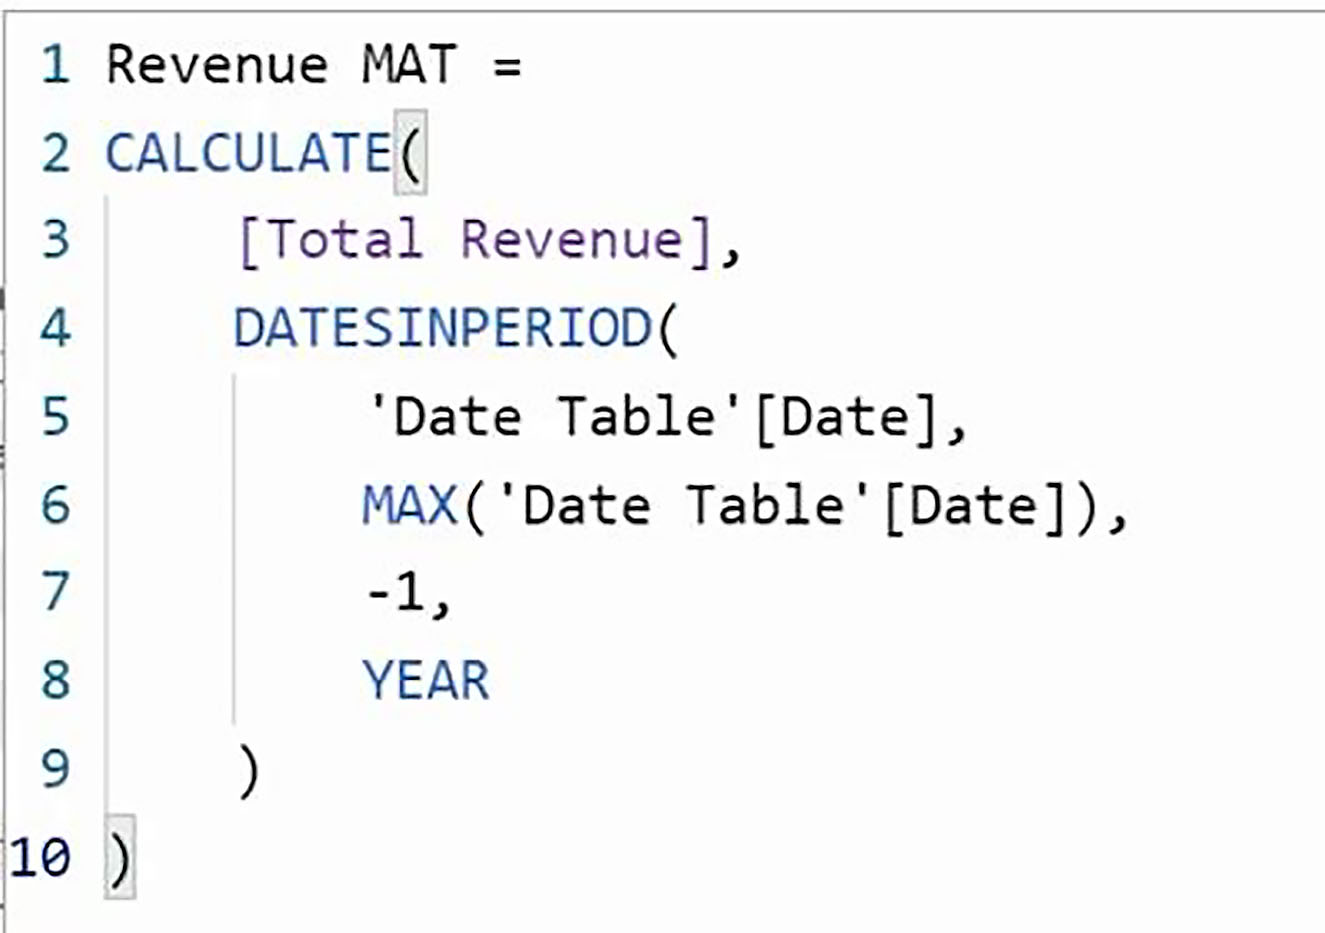
So, we will call the first measure Revenue MAT and, as per usual, we use in the CALCULATE function, and will be calculating Total Revenue. Then, for our filter argument, we use the DATESINPERIOD function.
The Dates argument will be ‘Date Table'[Date], and for our Start Date argument, we want the last date in the current period which can be obtain using MAX(‘Date Table'[Date]).
So, that is our starting point, and then of course, we are working backward from there. So, the Number of Intervals is minus one, and then the interval, or time units, is Year.
When we add our measure to the table visual, we can see that it takes 12 months before we have a full year’s worth of data. So, from January 2015, the Revenue MAT figure becomes a genuine moving annual total; and, as we move from month to month, we can always see our performance for the last 12 months.
Three-Month Moving Average
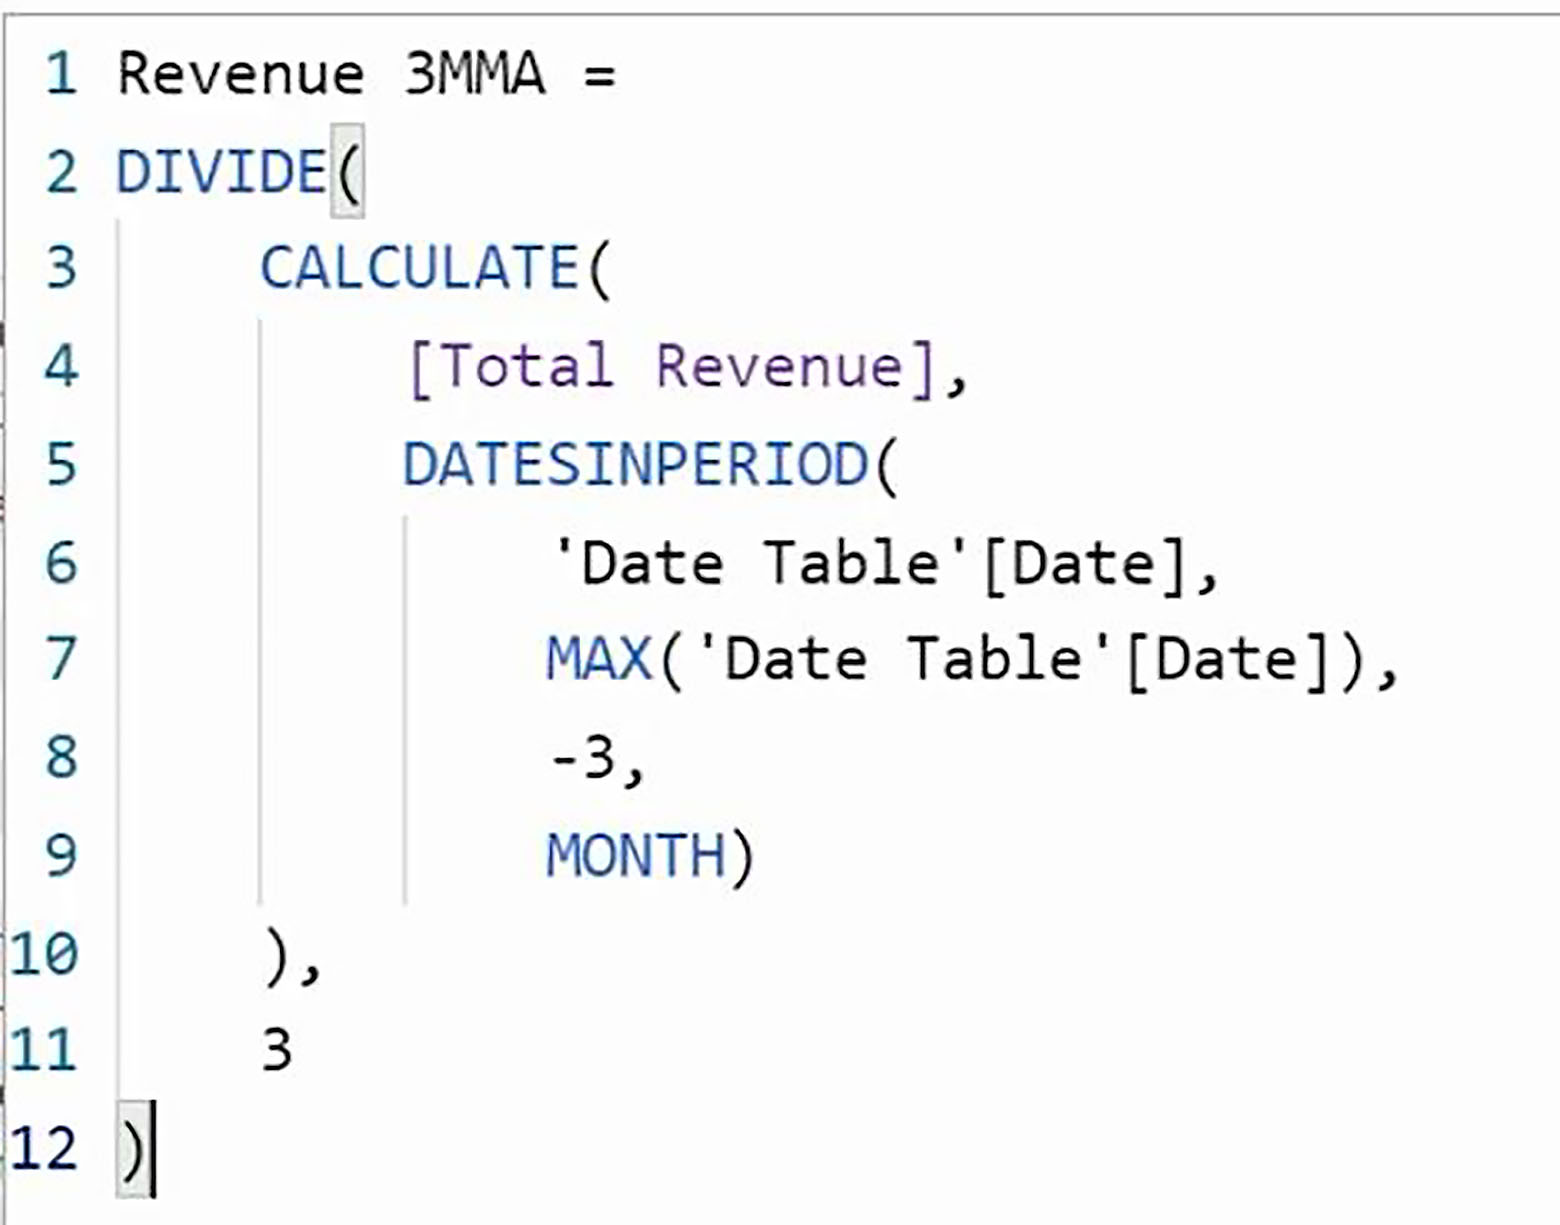
And now let us calculate our three-month moving average. We will call our measure Revenue 3MMA. And what we will do this time is we will work out the Revenue for the last three months. But of course, we then want a monthly average; so, we will need to divide the result by three.
So, we use the DIVIDE function. And, inside that, we use CALCULATE. The expression to be calculated is [Total Revenue], and then for our filter expression, we use DATESINPERIOD.
The Dates argument will be ‘Date Table'[Date]. And again, for our Start Date argument, we use MAX(‘Date Table'[Date]).
The Number of Intervals argument is minus three; i.e., the last three months. And the interval, or units, is Month.
So, all of that is the first argument of Divide, and of course, we are simply dividing by three. And let us say that the default blank is the best suppression for any potential errors. So, we do not need to supply the third argument of the DIVIDE function.
When we add our Revenue 3MMA function to our table visual, we can see that, starting from the third month, we have a figure which we can compare with the current month’s performance to see whether the current month is above or below the three-month moving average.