- You are here:
- Home »
- Blog »
- Power BI »
- Using Relationship Columns to Kickstart your Data Modelling

Using Relationship Columns to Kickstart your Data Modelling
(In this blog post/tutorial, we will use a database called “Event Sales”, which you can download here. If you wish to follow along, you will need to download and UnZip the .BAK file, then use it to restore the EventSales database on an instance of SQL Server.)
When connecting to a relational database from Power BI, it is often the case that you wish to rationalize and flatten the structure of the original database to make it more suitable for reporting purposes; and there are several possible workflows which will help you to achieve this goal.
The Ideal Workflow
Before we get to the use of relationship columns, the main topic of this post, I should stress that it is a feature which is used in “plan B”, which only kicks in when you do not have read/write access to the database to which you are connecting. If you are a DBA of the database in question, then you should use “plan A”, the ideal workflow; so, let’s start by summarizing this ideal workflow.
If you are the DBA of the database to which you want to connect, the ideal workflow is to create a series of views, on the database server; each of which will become a table in the Power BI data model. To illustrate this process, and to keep things simple, we will start with a relational database consisting of 11 tables and flatten this structure down to 4 tables.
In SQL Server Management Studio, let’s look inside the EventSales database which, hopefully, you have downloaded and restored; and, let’s examine the structure of the database by expanding the Database Diagrams folder and double-clicking the dbo.Default diagram.
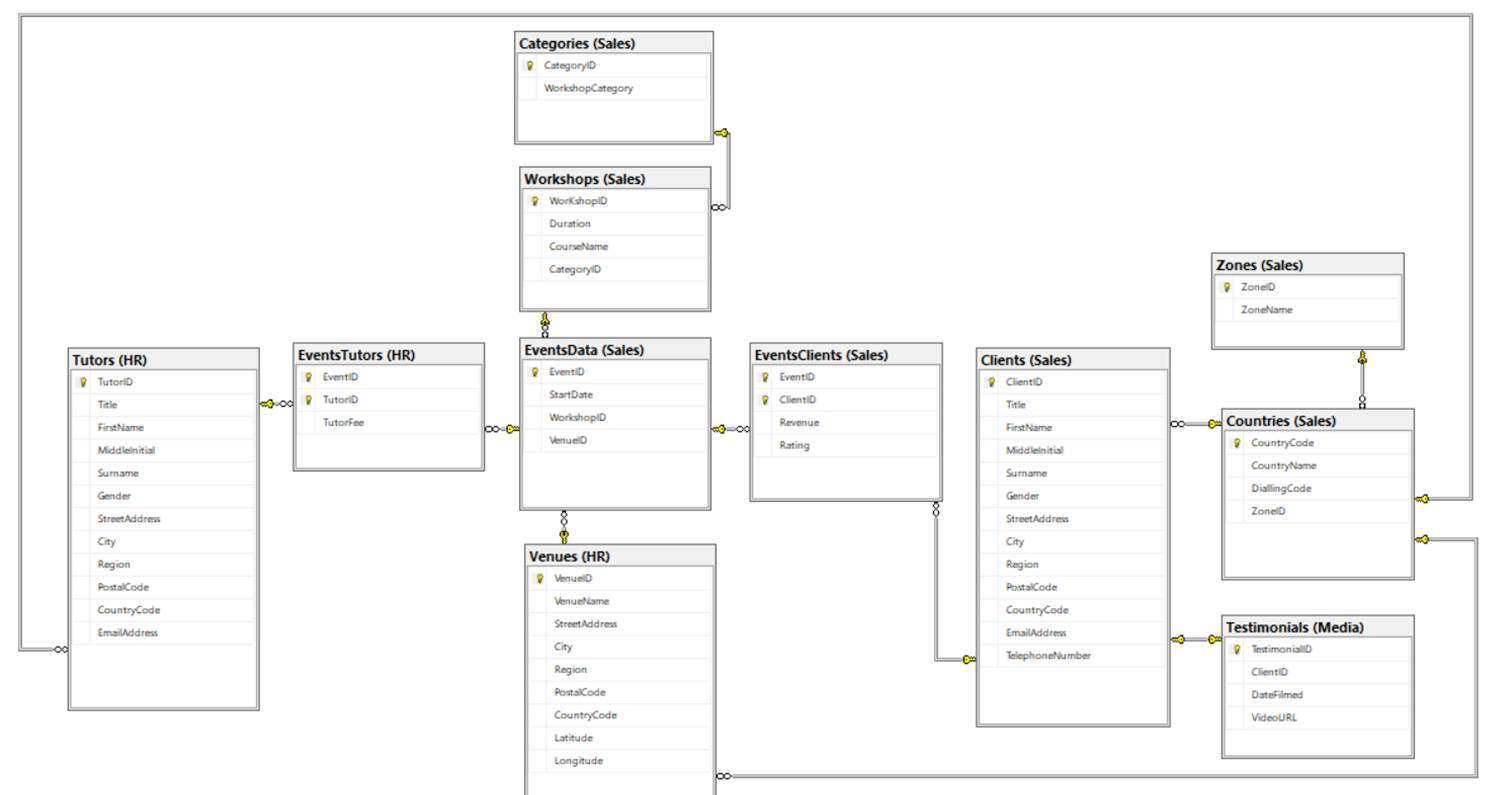
The database contains 11 tables which are listed below, in alphabetical order.
Categories (CategoryID, WorkshopCategory)
Clients (ClientID, Title, FirstName, MiddleInitial, Surname, Gender, StreetAddress, City, Region, PostalCode, CountryCode)
Countries (CountryCode, CountryName, DialingCode, CountryZoneID)
EventsClients (EventID, ClientID, Revenue, Rating)
EventsData (EventID, EventID, StartDate, CourseID, VenueID)
EventsTutors (EventID, TutorID, TutorFee)
Testimonials (TestimonialID, ClientID, DateFilmed, VideoURL)
Tutors (TutorID, Title, FirstName, MiddleInitial, Surname, Gender, StreetAddress, City, Region, PostalCode, CountryCode, EmailAddress)
Venues (VenueID, VenueName, StreetAddress, City, Region, PostalCode, CountryCode, Latitude, Longitude)
Workshops (CourseID, Duration, CourseName, CategoryID)
ZoneID (ZoneID, Zone)
Now, let us compare this structure with that of the data model which we want to create from the database, in Power BI.
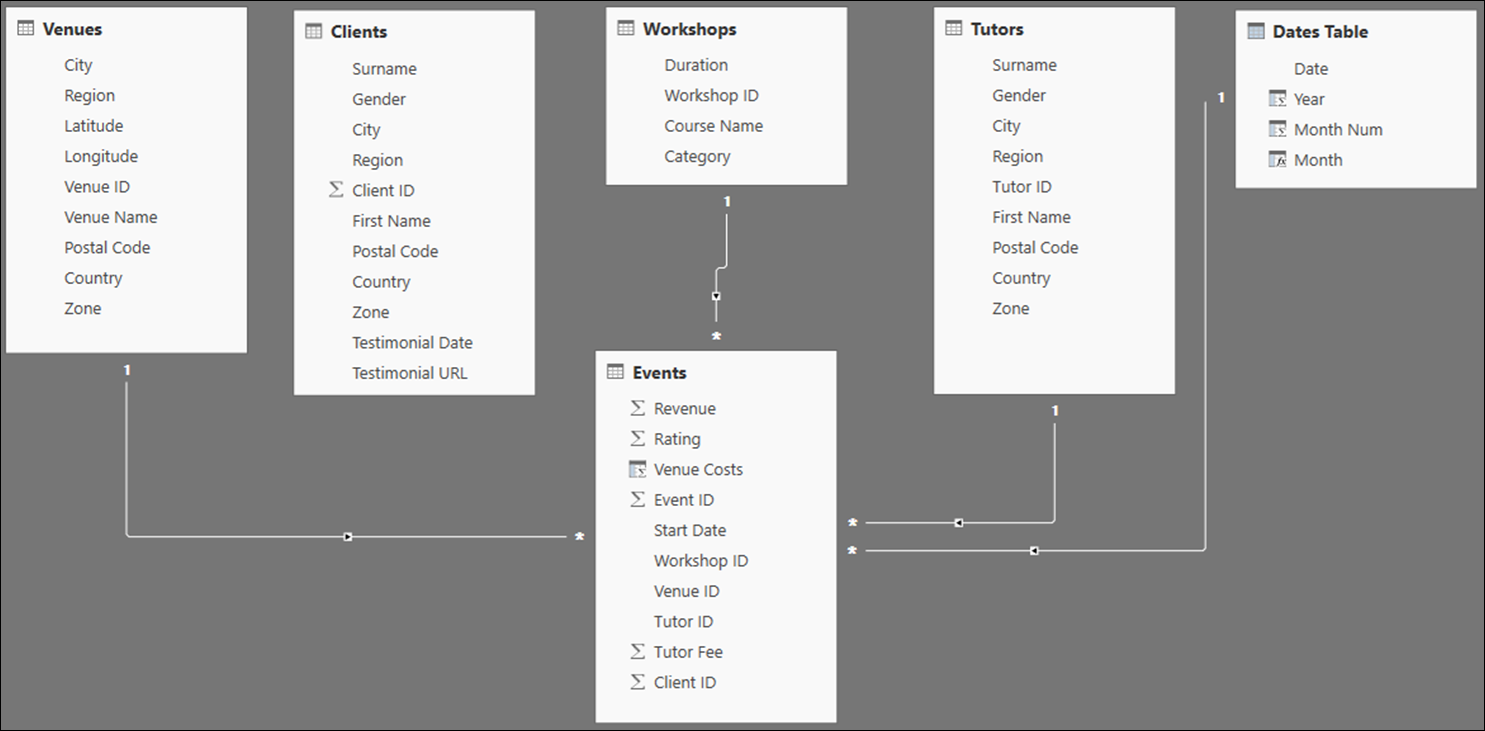
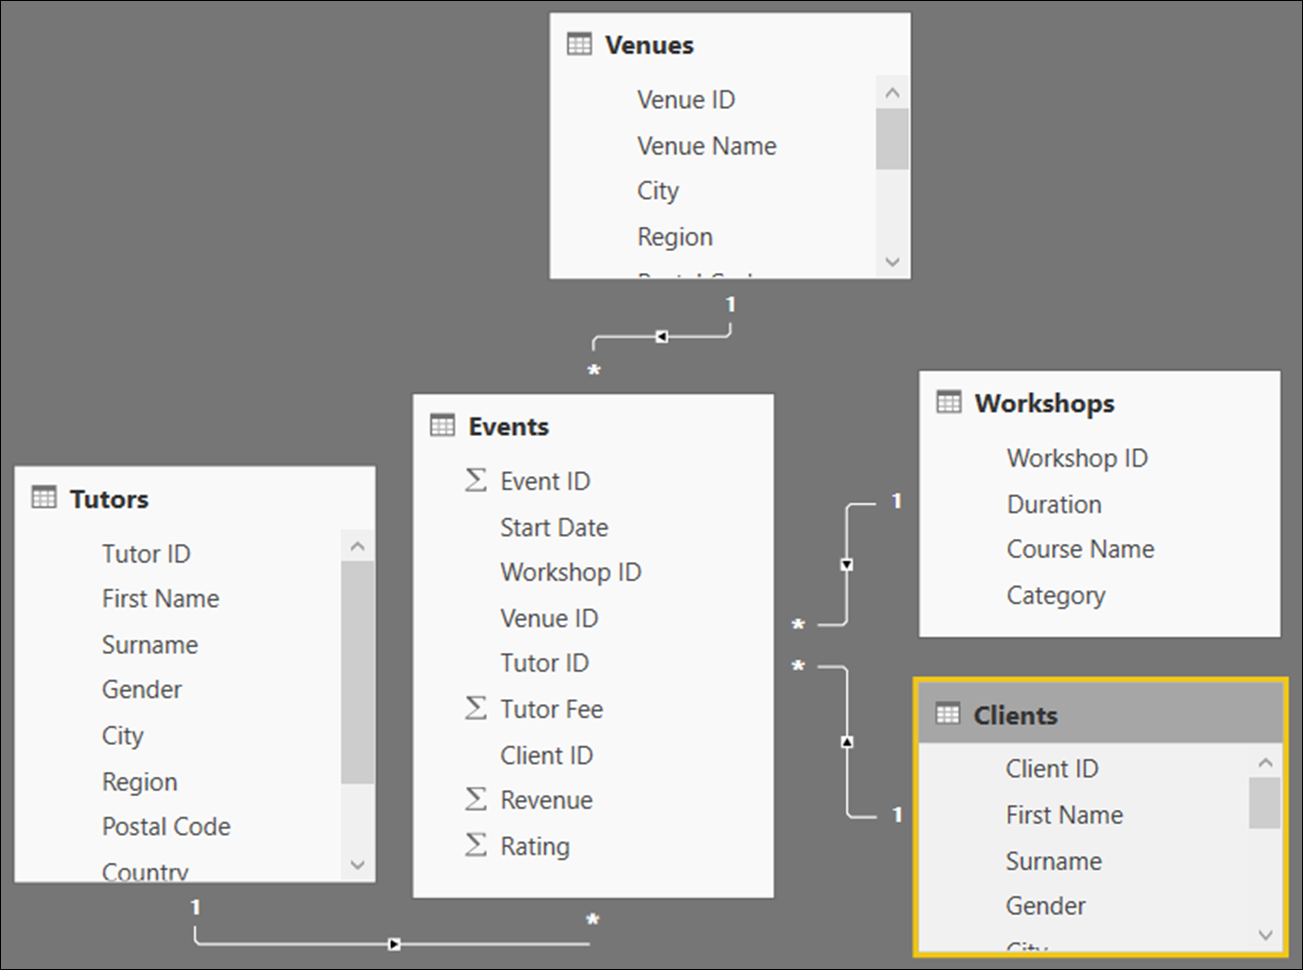
In the data model, we have six tables, only five of which have been imported from the original database:
Clients (First Name, Surname, Gender, City, Region, Postal Code, Country, Zone, Testimonial Date, Testimonial URL)
Events (Event ID, Start Date, Workshop ID, Venue ID, Tutor ID, Tutor Fee, Client ID, Revenue, Rating)
Tutors (Tutor ID, First Name, Surname, City, Region, Postal Code, Country, Zone)
Venues (Venue ID, Venue Name, City, Region, Postal Code, Latitude, Longitude, Country, Zone)
Workshops (Course ID, Duration, Course Name, Category).
The final table in our data model, Dates Table, is a dynamic DAX table created in Power BI:
Dates Table (Date, Year, Month Num, Month)
(Almost all data models in Power BI require a date table containing all the different date and time related categories by which you want to categorize your data.)
This reduction in the number of tables from database to data model is typical of Power BI workflows. As our focus shifts towards reporting and analysis, we denormalize the relational database and introduce a certain amount of redundancy in order to facilitate data analysis.
For example, in the database, since only a small percentage of our clients provide a testimonial, we had a separate Testimonials table which had a one-to-one relationship with the Clients table. In the data model, the key testimonial fields (Testimonial Date and Testimonial URL) have been brought into the Clients table, and Testimonials no longer exists.
As you probably know, the table structure inside our data model is referred to as a star schema. It consists of a single main table, referred to as a fact table; and several supporting tables, all linked to the central fact table, which will be used to categorize the data in the fact table, and which are referred to as dimension tables.
To convert the original relational database structure into a star schema, the EventsClients, EventsData and EventsTutors tables have been combined to form a single fact table called Events. Workshops and Categories have been combined into a single dimension table called Workshops. And the information in the Countries and Zones tables has been imported into the Clients, Tutors and Venues tables, which constitute the remaining dimension tables derived from the original database.
When importing data from SQL Server, you always need to think ahead to the data model you wish to create and devise a strategy which will facilitate its creation. In general, the most efficient approach is to avoid connecting directly to the tables in your relational database. Instead, you can create a series of views, each corresponding to one of the tables which will be present in your data model. In Power BI, you then connect to these views rather than to the original database tables.
Taking this approach makes it easier to update your Power BI data models if modifications are made to the database tables or to the database structure. It also means that you will not have different teams of people, making the same, possibly complex changes to their Power BI datasets to create similar data models.
If most of the transformational logic takes place when the views are created, and report creators connect to the views, all you need to do is to synchronize changes to the database with your views; a much more straightforward task than attempting to synchronize changes to the database with multiple Power BI reports.
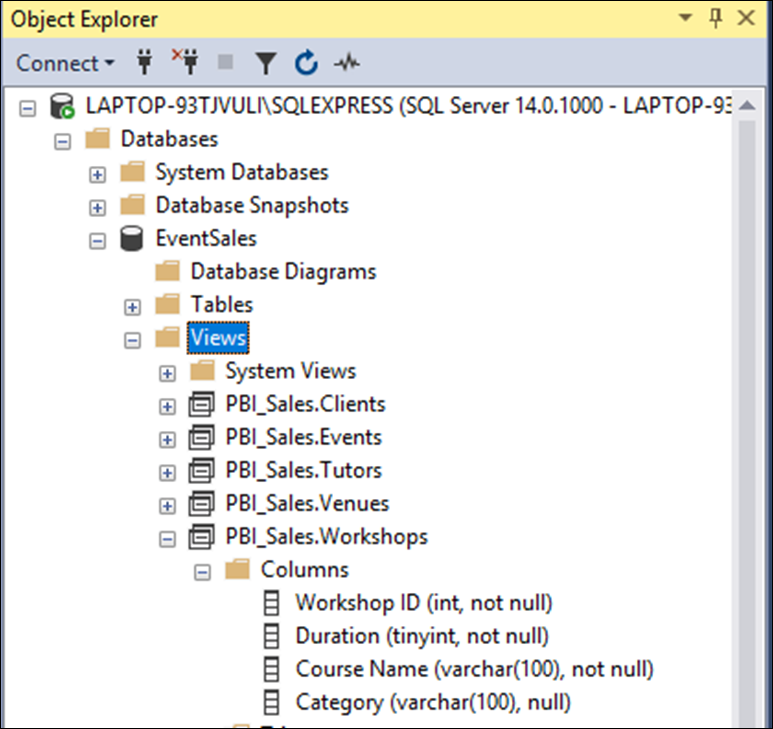
In SQL Server Management Studio’s Object Explorer, expand the Views folder. Inside, you will find the five views which can be imported straight into Power BI. For convenience, all these views have been placed inside a schema called “PBI_Sales”.
If you expand the Views section and drill down into the columns, you will notice that the columns have also been given report-friendly names; for example, “Course Name”, rather than “CourseName”.
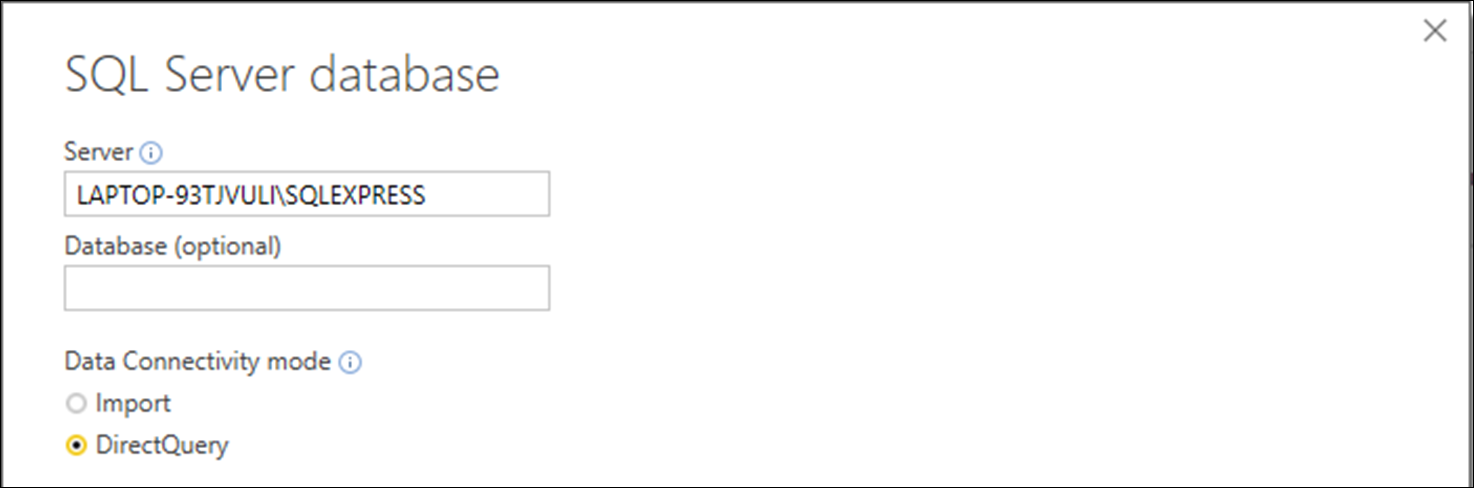
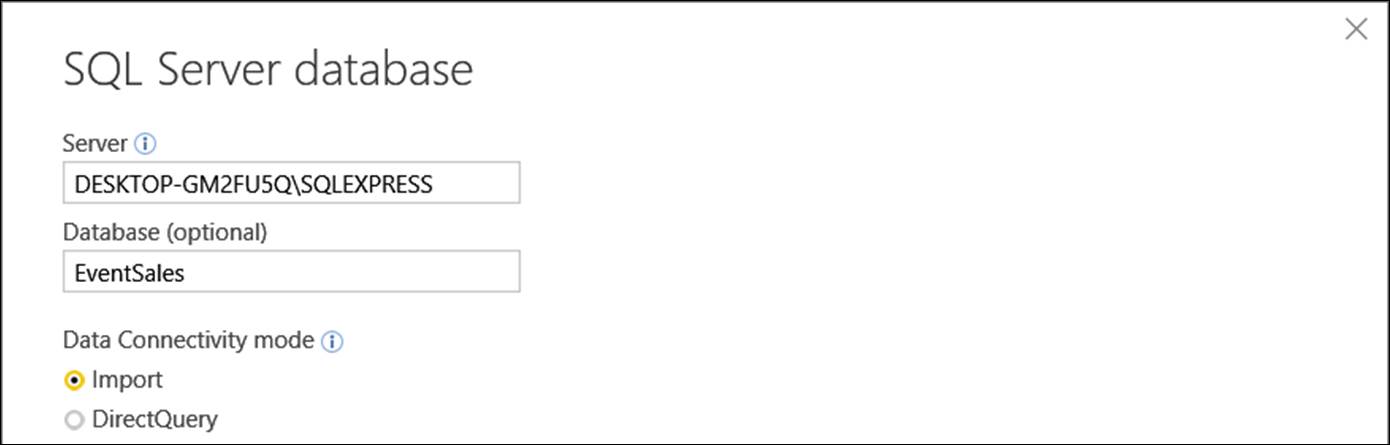
In a blank Power BI file, let us now import these views. To import data from a SQL Server database, choose Home > Get Data > SQL Server. When the SQL Server connection dialog appears, enter the name of your SQL Server instance in the Server field. (To save typos, you can right-click on the server name in the Object Explorer, choose properties, then copy the entry in the Name field.)
You do not need to enter a name in the Database field; since, if the database field is left blank, when you click the OK button, you will be given access to all the databases on the server. This is particularly useful if you have databases with similar names; since recognition is usually easier than recall.
Let’s set the Data Connectivity mode to Import though this will have no impact on the features we are discussing.
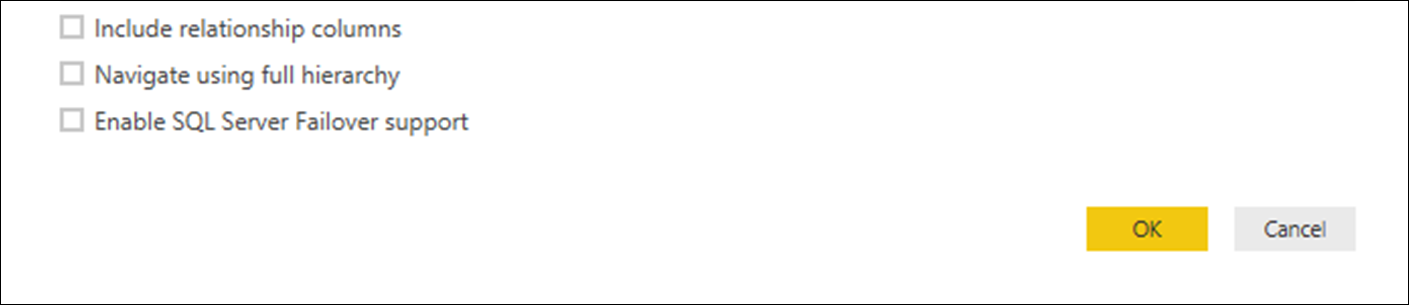
Click on the Advanced options button and make sure that that Navigate using Full Hierarchy is checked.
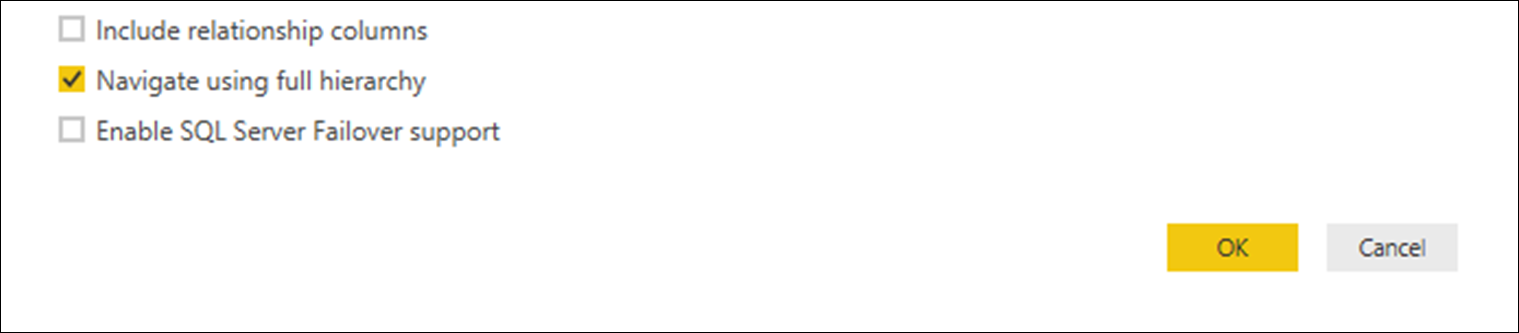
This causes Power BI to display all objects in easily recognizable groups, making it much easier to find stuff.
Click OK.
Authentication Mode
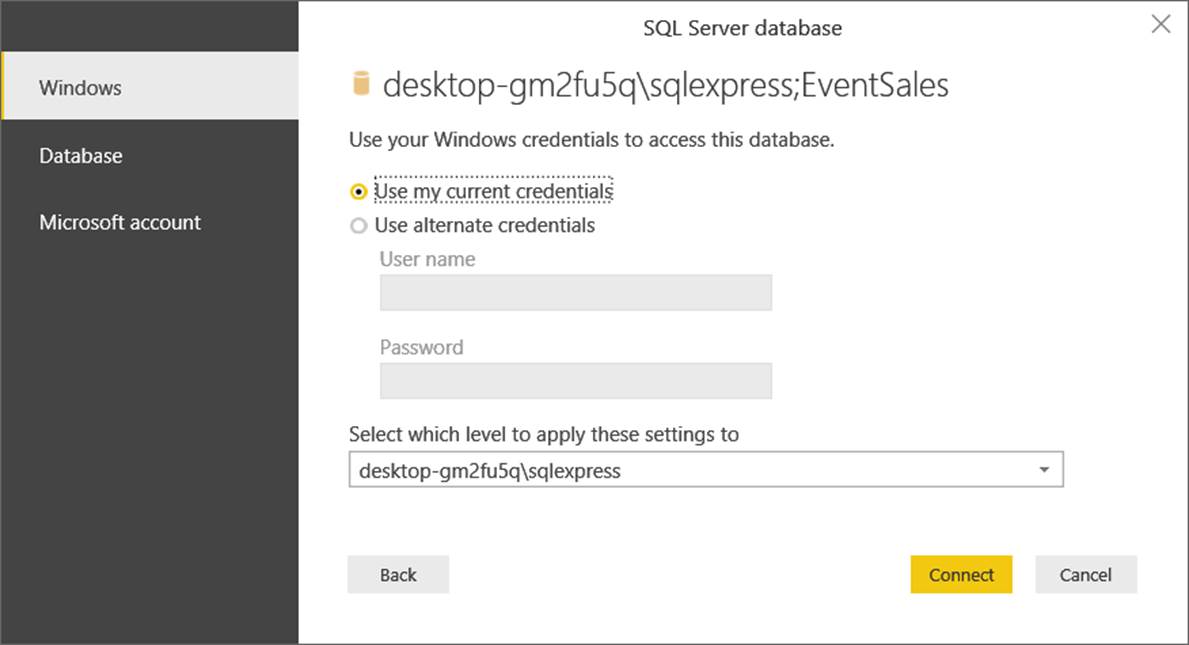
When you connect to SQL Server, you need to specify the authentication mode you wish to use. There are three options: Windows, Database and Microsoft account.
The default selection, Windows, should be selected if you wish to connect using Windows authentication. If you performed an install of SQL Server Express using the default options, you will be able to connect to the database using your Windows login credentials. Simply leave the default Windows > Use my current credentials activated, as shown below.
In most production scenarios, you will connect using SQL Server authentication. After you select this option, specify a user name and password to connect to your SQL Server instance.
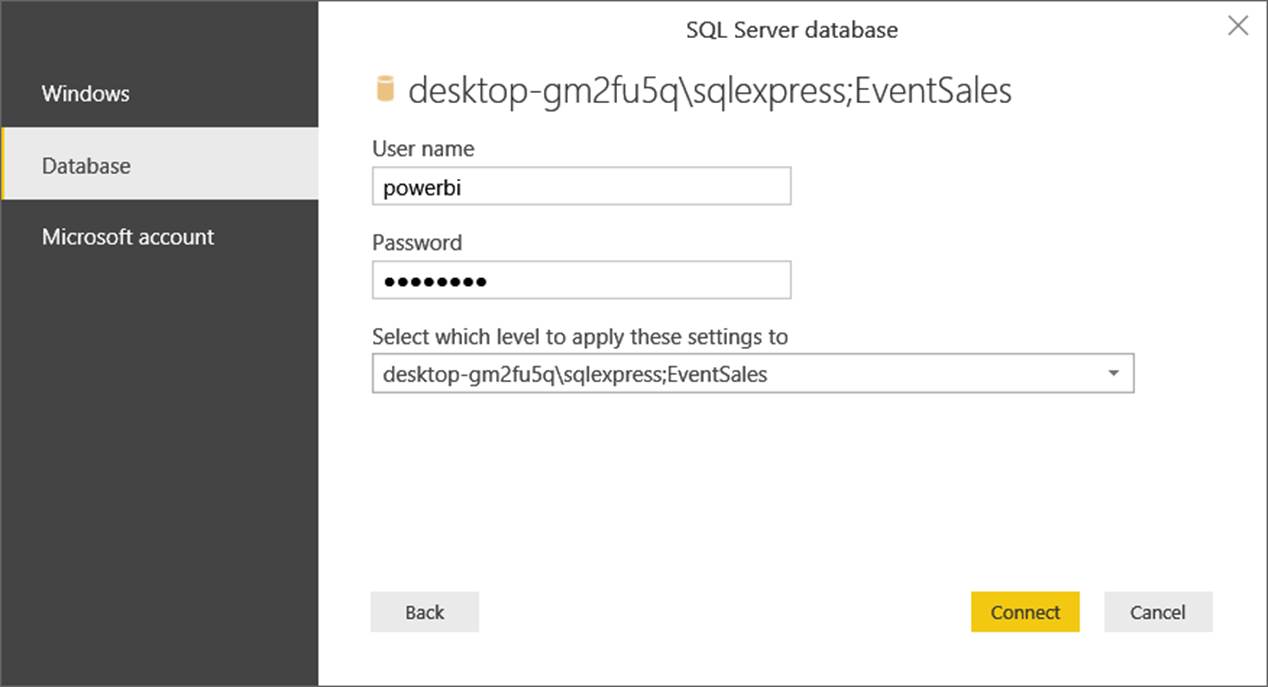
Click the Connect button to advance to the next screen.
If you receive a message regarding encryption (“We were unable to connect to the data source using an encrypted connection. To access the data source using an unencrypted connection, click OK.”), you can click OK to dismiss it. By default, Power BI attempts to encrypt the connection; clicking OK deactivates this default option.
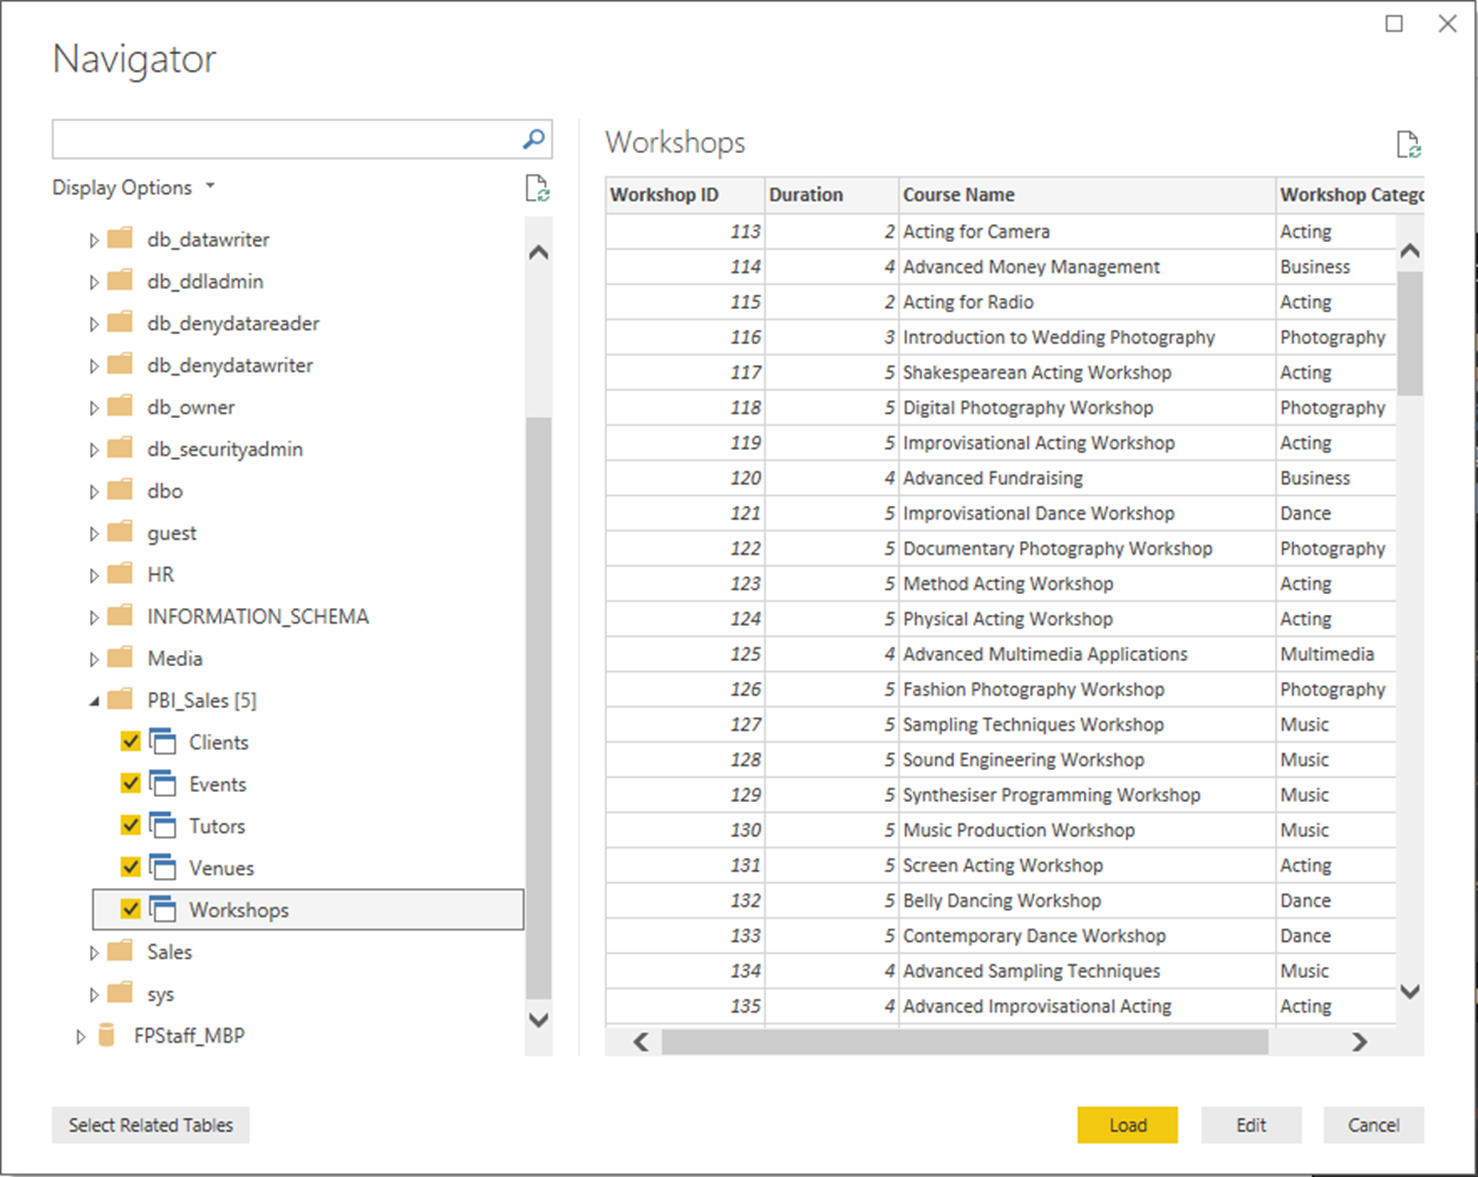
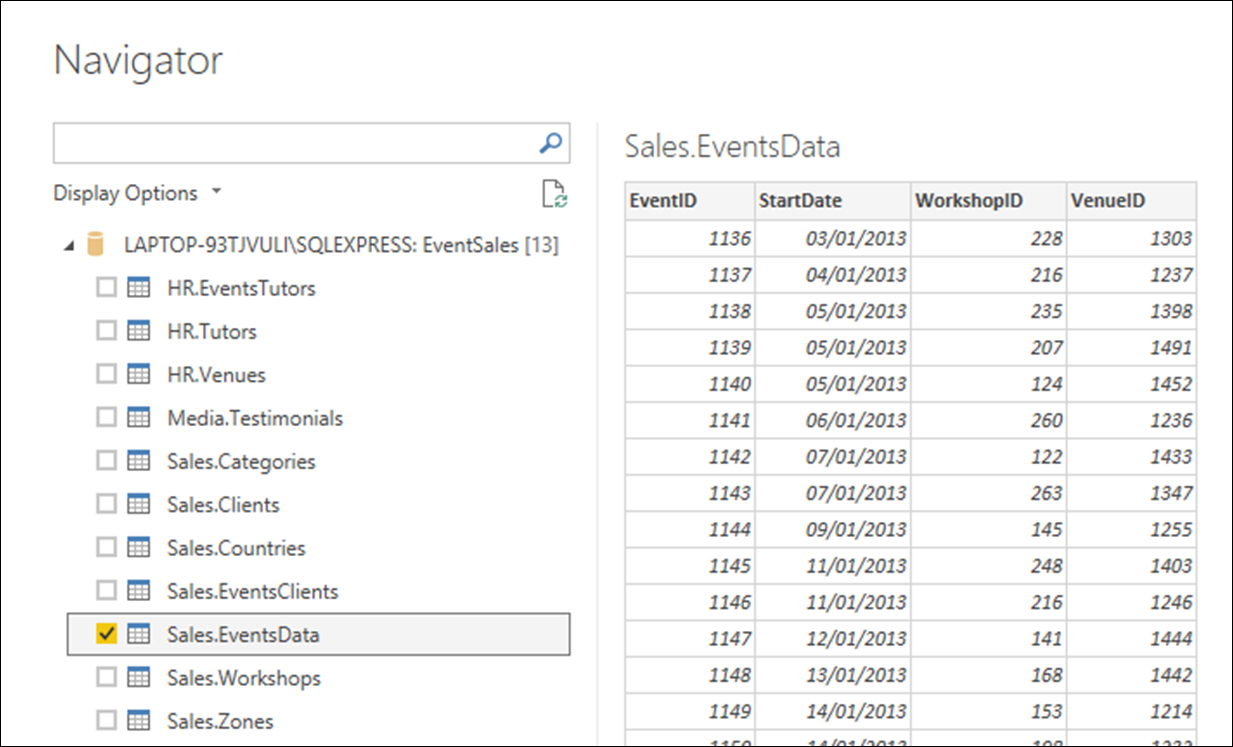
In the Navigator window, use the arrows on the left to expand, first, the SQL Server instance, then EventSales > PBI_Sales (the name of our view). Click in the checkboxes next to each of the five views to activate them, then click the Load button.
Once the data has been loaded into Power BI, click on the Relationships button on the left of the screen, and you will see that Power BI has automatically created relationships between each of the four dimension tables and the main fact table, Events.
Note that this has only happened because of the naming convention we have used: for example, “Client ID” in the Clients table has been associated with “Client ID” in the Events table, and so forth.
Connecting to Database Tables Using SQL Statements
We have seen that, when connecting to SQL Server, it is best to create views and then connect to your views from Power BI, in preference to the underlying tables. However, this may not always be possible; for example, if you are not the DBA of the SQL Server instance, you may not have the authority to create all the required resources.
One way of proceeding in such situations is to use SQL statements. The same statements that you would use to create views in the SQL Server database can be executed from within Power BI.
For example, let us use an SQL statement to combine the three transactional tables (EventsClients, EventsData and EventsTutors) into a single fact table, as we did when creating views, we could execute the following SQL Statement.
SELECT Sales.EventsData.EventID ‘Event ID’
, Sales.EventsClients.ClientID ‘Client ID’
, Sales.EventsClients.Revenue
, Sales.EventsClients.Rating
, Sales.EventsData.StartDate ‘Start Date’
, Sales.EventsData.WorkshopID ‘Workshop ID’
, Sales.EventsData.VenueID ‘Venue ID’
, HR.EventsTutors.TutorID ‘Tutor ID’
, HR.EventsTutors.TutorFee ‘Tutor Fee’
FROM Sales.EventsClients
INNER JOIN
Sales.EventsData ON Sales.EventsClients.EventID = Sales.EventsData.EventID
INNER JOIN
HR.EventsTutors ON Sales.EventsData.EventID = HR.EventsTutors.EventID
To create the data model which we discussed in the previous section, we could proceed in this manner, executing a series of SQL statements equivalent to those used for creating the views which we imported earlier.
However, if we were to do this, we would be disabling a very useful Power BI feature, called query folding, which we will discuss shortly. So, the bottom line is, when connecting to a SQL Server (or similar) database, executing raw SQL statements is the least desirable approach.
Leveraging Query Folding and Relationship Columns
Query folding is the process whereby some, or all, of the transformations you define in the Query Editor are converted into SQL statements and executed by the database server. This can provide a significant performance boost each time the data source is refreshed. However, only SQL statements automatically generated by Power BI are permitted; if you execute your own SQL statement; or, if you use a Query Editor transformation which has no SQL equivalent, no further query folding takes place.
So, let us look at how we might create the Events fact table that we discussed earlier, incorporating the main columns from the EventsData, EventsClients and EventsTutors tables, while taking full advantage of query folding and the relationship columns feature.
Choose Home > Get Data > SQL Server. In the SQL Server database dialog, enter the name of your SQL Server instance in the Server field and “EventSales” in the Database field.
What we will do is to import only the EventsData table; and then use a feature called Include relationship columns, to add the required columns from the related EventsClients and EventsTutors tables. (The Include relationship columns feature uses query folding.)
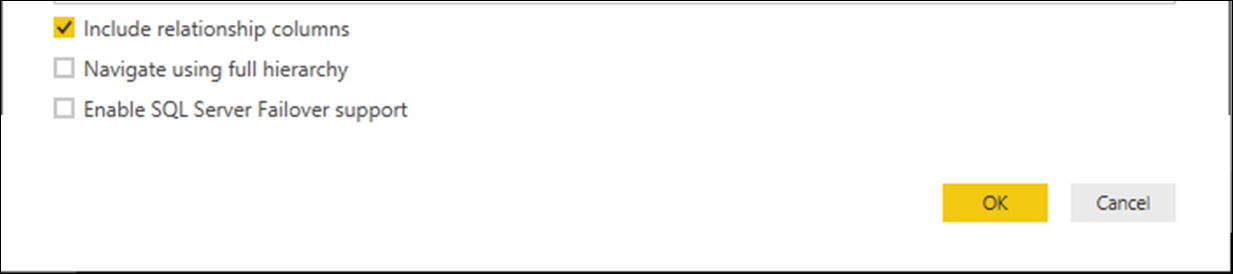
To understand how Include relationship columns works, let us begin by deactivating it. It is activated by default; so, click on the arrow to reveal the Advanced options section and click in the checkbox to deactivate Include relationship columns.
When the Navigator window appears, click in the checkbox next to the Sales.EventsData table. Look at the preview which appears on the right of the dialog, and you will notice that only the four columns which the table actually contains are displayed. This is what we might call normal behaviour.
Now, press Cancel, so that we can contrast this result with the one produced when Include relationship columns is activated.
Choose Home > Get Data > SQL Server once more. In the SQL Server connection dialog, enter the name of your SQL Server instance in the Server field and “EventSales” in the Database field.
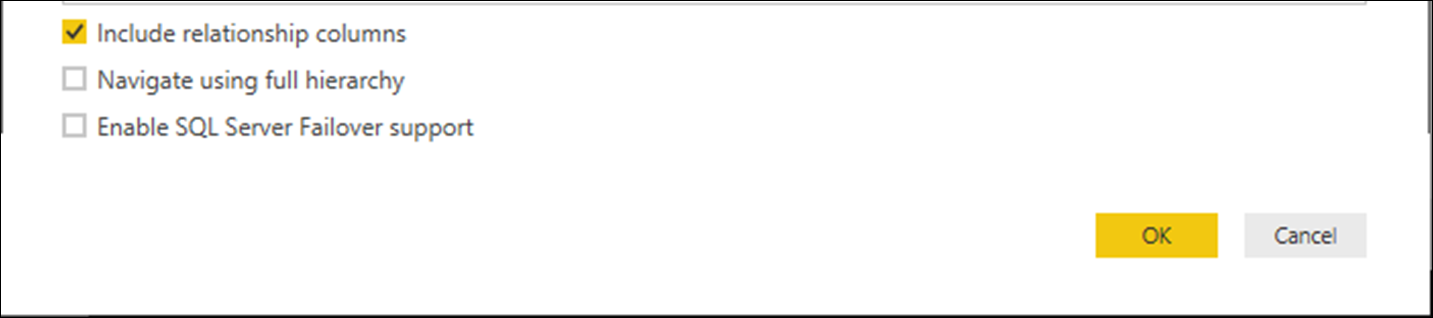
Click on the arrow to reveal the Advanced options section and, this time, click in the checkbox to reactivate Include relationship columns.
Click OK and, when the Navigator window appears, click in the checkbox next to the Sales.EventsData table. This time, on the right of the dialog, you will notice that in addition to the four columns which the table actually contains (EventID, StartDate, CourseID, VenueID), four extra columns are displayed (HR.EventsTutors, HR.Venues, Sales.EventsClients, and Sales.Workshops). (You will need to scroll to the right to see these extra columns.)
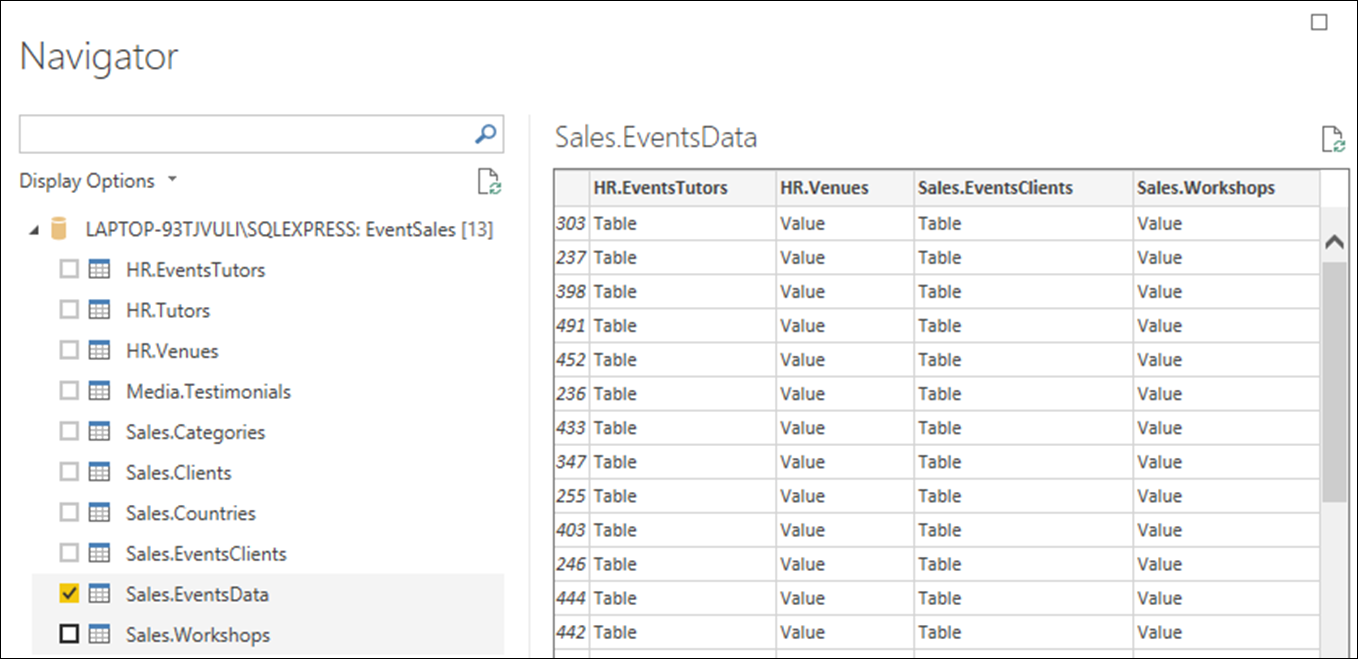
These are the relationship columns. Notice how the names of the columns correspond to the names of the four tables which are directly linked to the Sales.EventsData table.

When Include relationship columns is checked, Power BI creates extra columns containing binary data which links to each of the tables directly related to the current table.
In the Query Editor, we can use the Expand button to add any of the columns in the related tables into the current table. So, click on the Edit button to import the data and open the resulting query in the Query Editor.
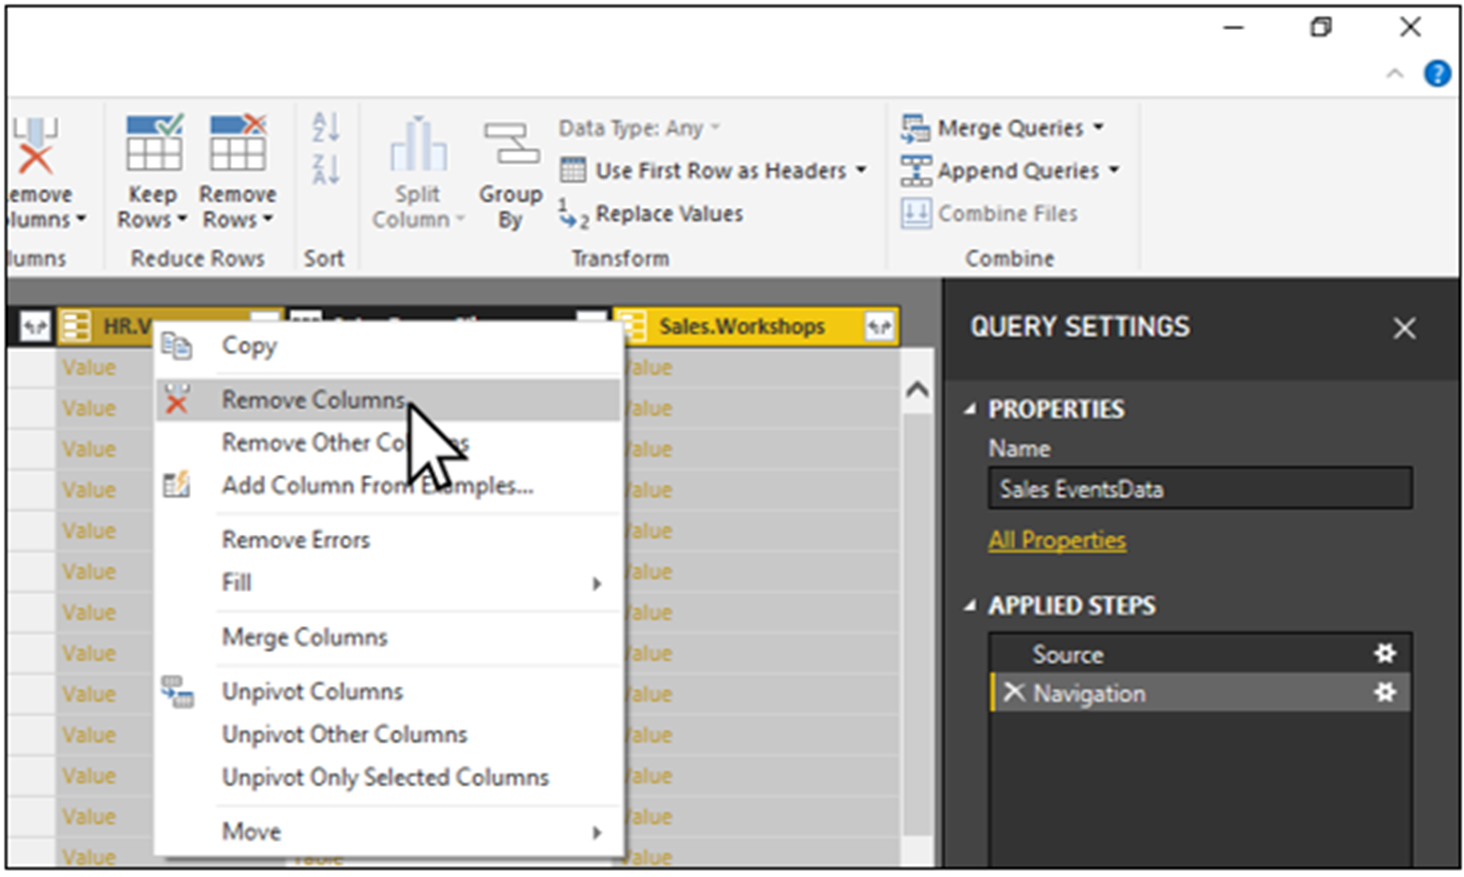
We now want to add all of the pertinent columns in the HR.EventsTutors and Sales.EventsClients tables into Sales.EventsData. This means that we can begin by selecting and removing the HR.Venues and Sales.Workshops columns, since they do not contain any of the columns that we want to add.
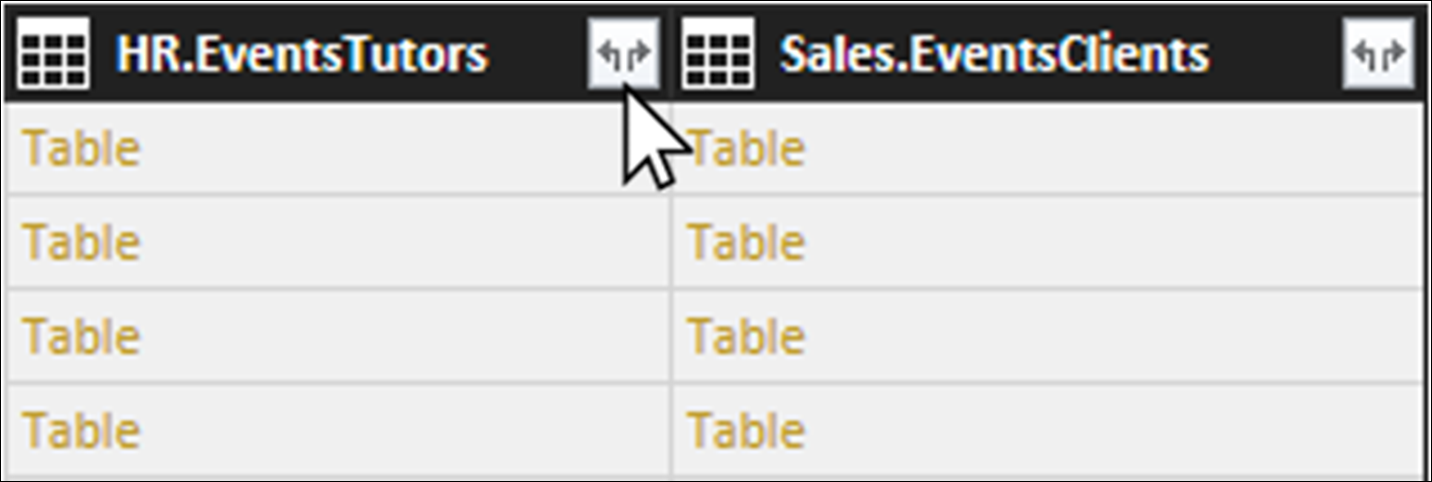
Next, let us click on the Expand button on the right of the HR.EventsTutors column.
In the dialog which appears, deactivate all the checkboxes except for TutorID and TutorFee; since these are the only two options which represent actual data. (We do not need to import the EventID column, since this would simply be a duplication of the existing EventID which is the primary key of the EventsData table.
Let us also deactivate the option Use original column name as prefix; this is only useful where the columns we are importing have some names which are the same as those of the columns in the current table.
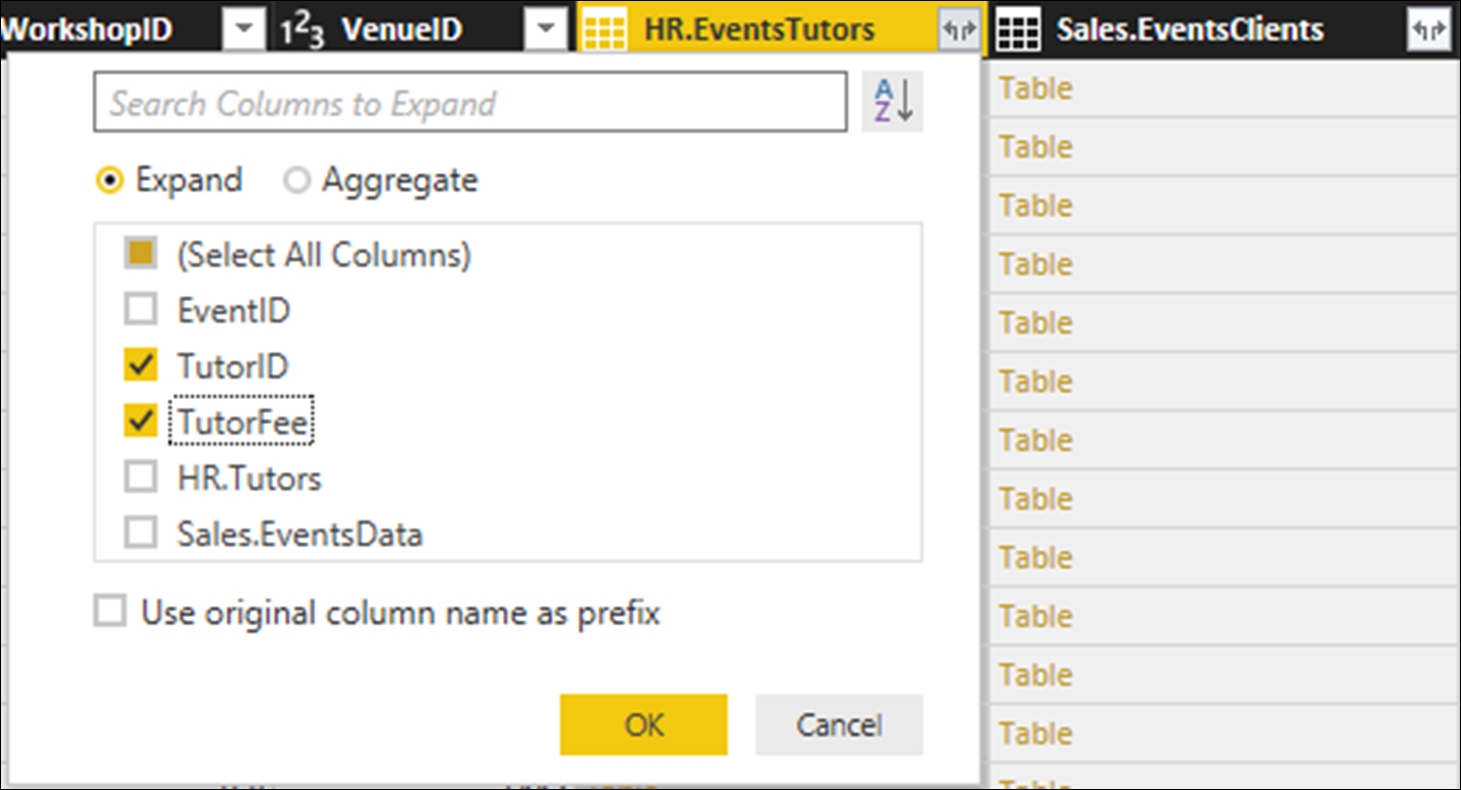
Click OK and the TutorID and TutorFee columns are imported into the Sales.EventsData table.
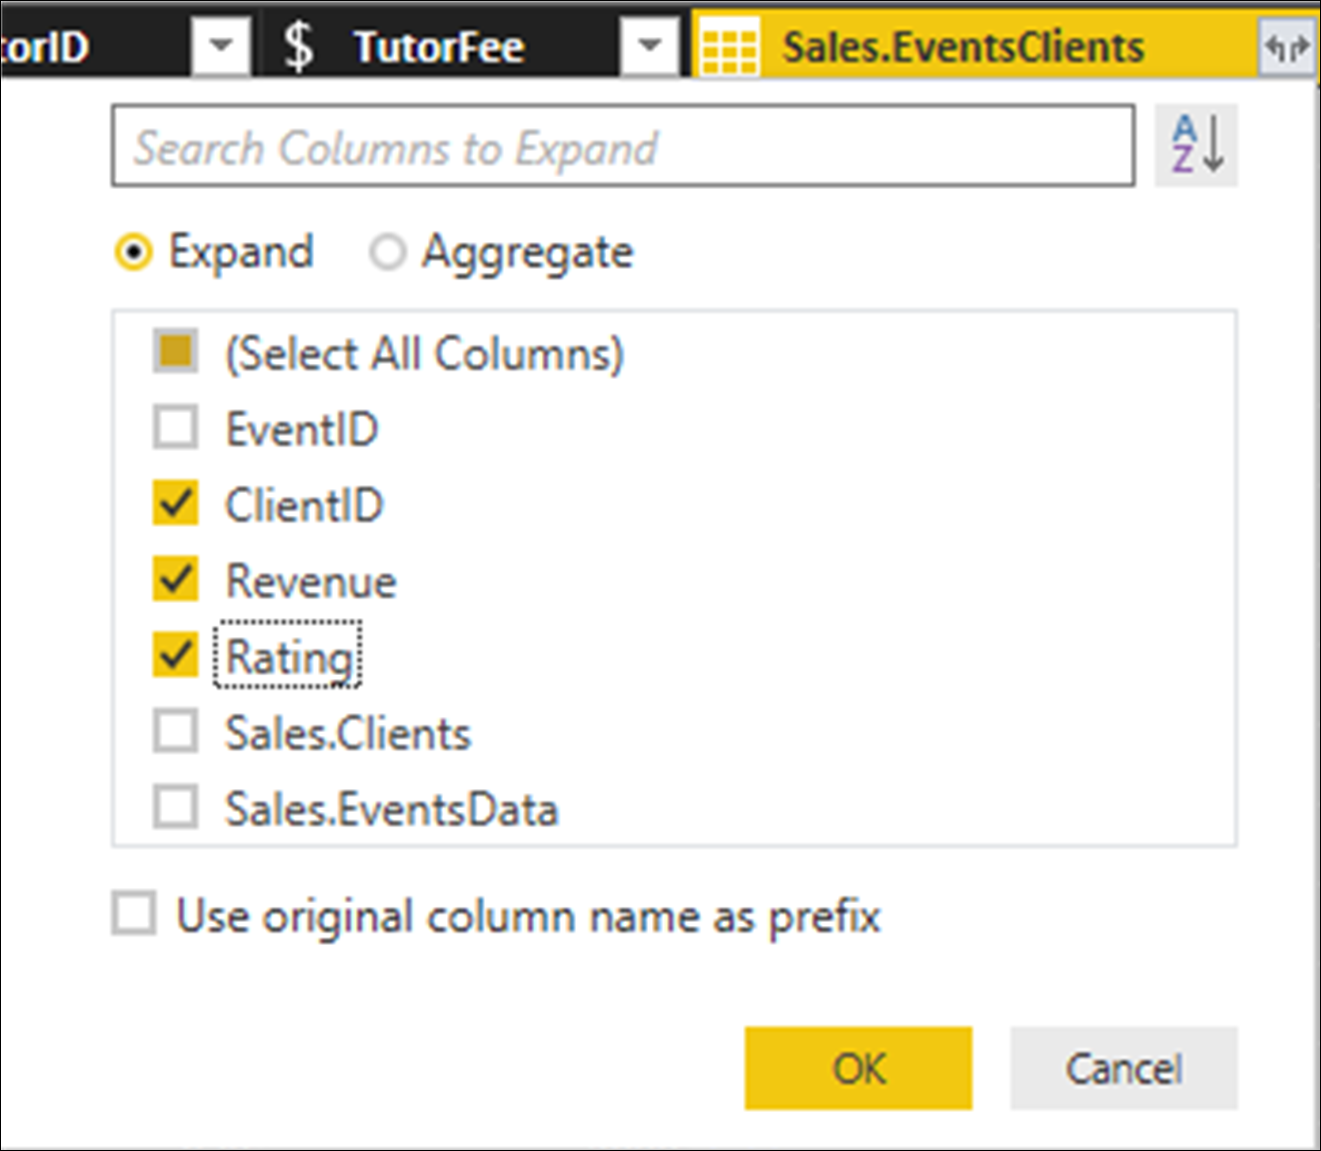
Now, let us do the same for the Sales.EventsClients column. Click on the Expand button on the right of the Sales. EventsClients column. In the dialog which appears, deactivate all the checkboxes except for ClientID, Revenue and Rating; and deactivate the option Use original column name as prefix.
Now, we have a single table containing all the main data which we want to analyse, and we can also benefit from query folding.
Query Folding and Native Queries
As we have said, query folding is the mechanism whereby Power BI creates SQL statements which are equivalent to the transformational steps carried out in the Query Editor; and, on each reload, executes these steps against the SQL Server database, in preference to using the M language to perform the transformations in Power BI.
To monitor Power BI’s query folding decisions, right-click on a Navigation step and choose View Native Query from the context menu.
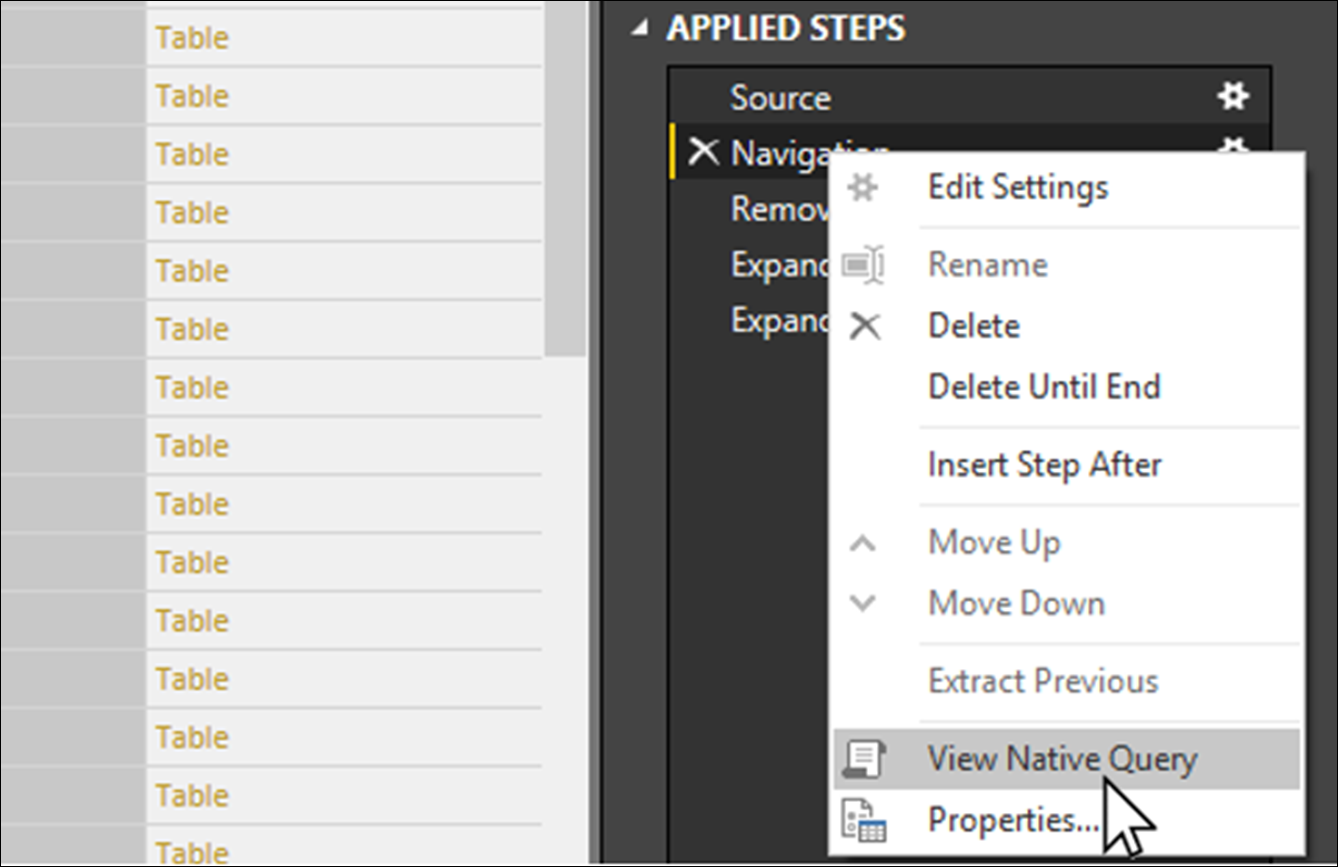
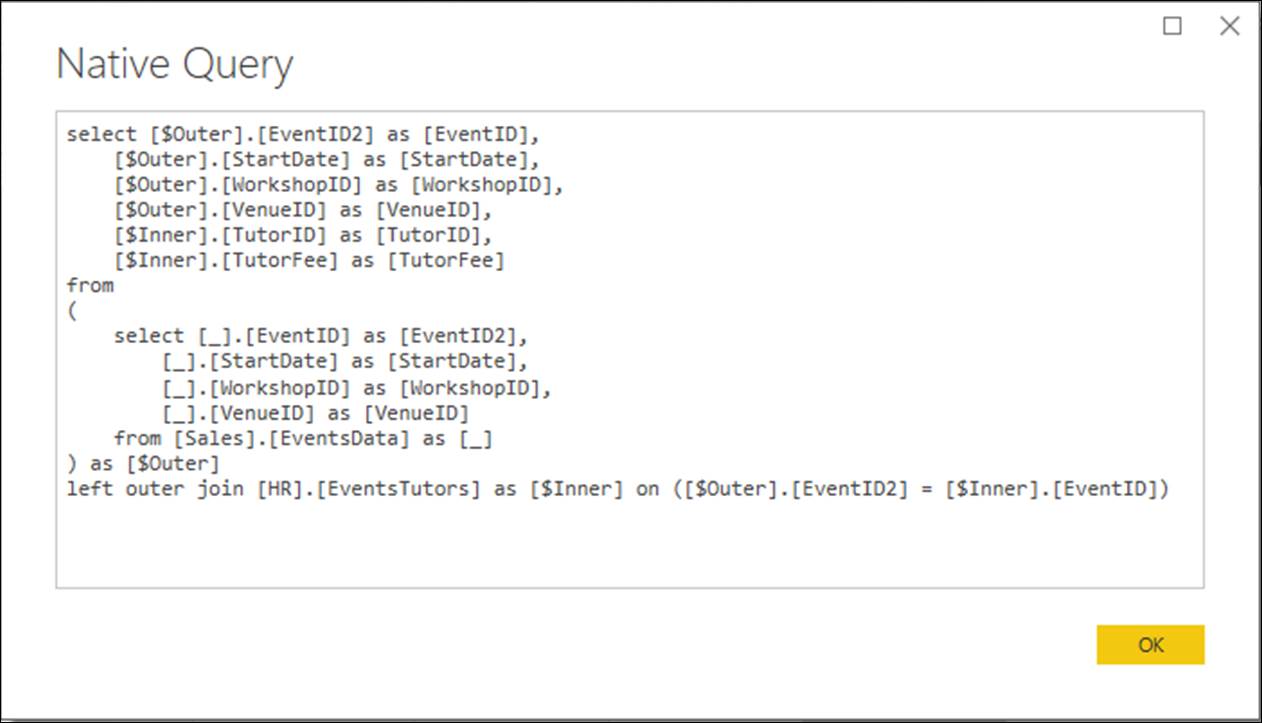
Power BI displays the Native Query dialog within which is displayed the SQL statement which will be executed when this step is encountered.
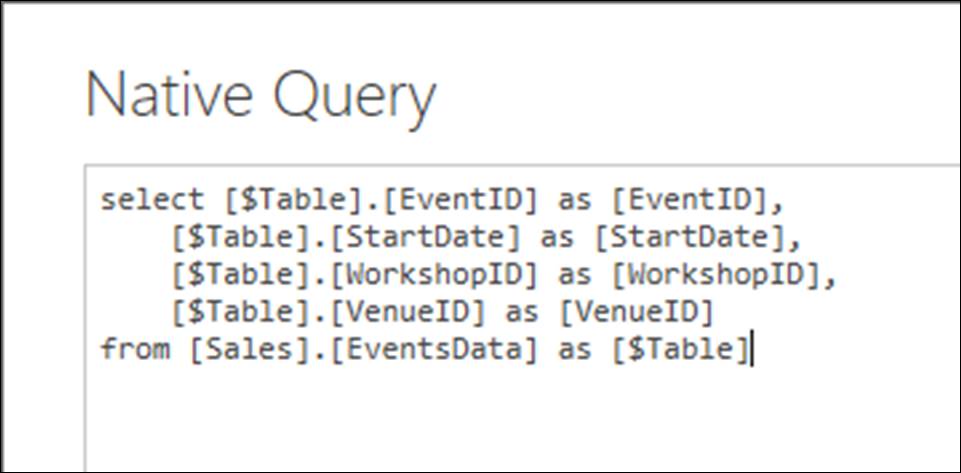
Now, right-click on each of the Expanded HR.EventsTutors step and choose View Native Query from the context menu. In the Native query window, you will see the SQL statement which SQL Server will be asked to execute when each step is traversed.
When creating Power BI reports, it makes sense to ensure that all, or as many as possible, of the operations you perform in the Query Editor will be executed as native queries; since this will help to improve the refresh rates of your reports. The key points to note are as follows.
Query folding will take place whenever a Query Editor transformation can be converted from the underlying M language into an SQL statement.
If you create a query by executing an SQL statement of your own, query folding will not be possible in any M transformations you subsequently perform.
· On the first occasion where there is no SQL equivalent to a Query Editor step that you perform, query folding will cease to occur; not only for that step, but for all subsequent steps.
Creating the Dimension Tables
Hopefully, using the steps outlined above, you will be able to create the remaining four tables required for our data model: Clients, Tutors, Venue and Workshops. For this reason, I will only outline the creation of one of the four; the Clients table.
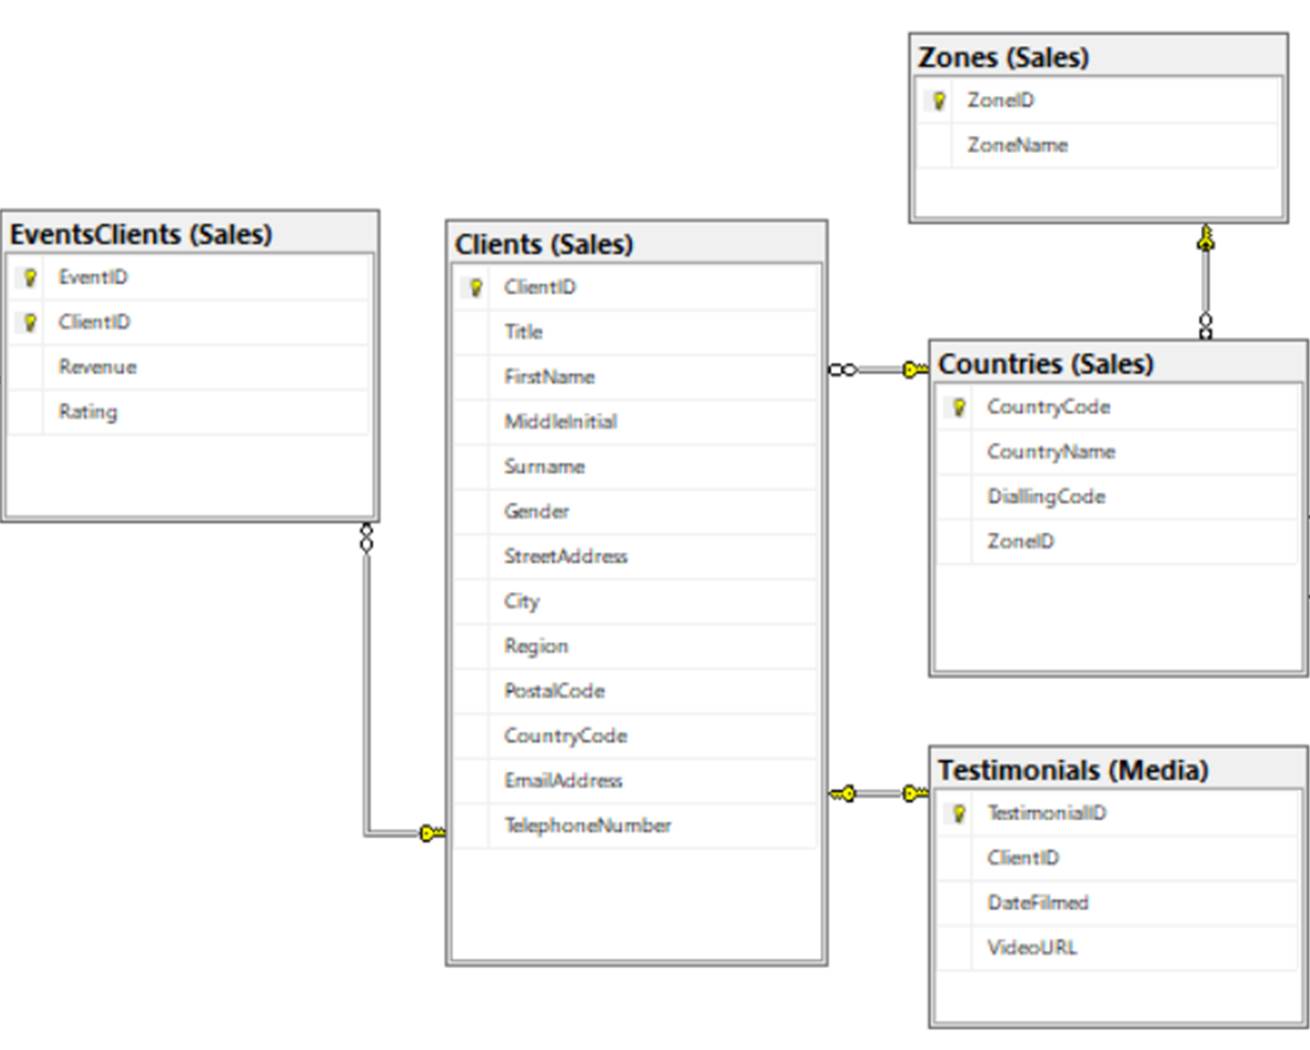
This will give us a chance to see how the relationship columns feature can be used to incorporate data from tables which are not directly linked to the table to which you are connecting. In this example, we will bring in data from the Zones table into Clients; and, as you can see from the diagram, Zones is not directly linked to Clients; rather, it is indirectly linked, via the Countries table.
Choose Home > Get Data > SQL Server once more. In the SQL Server connection dialog, enter the name of your SQL Server instance in the Server field and “EventSales” in the Database field.
Click on the arrow to reveal the Advanced options section and activate Include relationship columns.
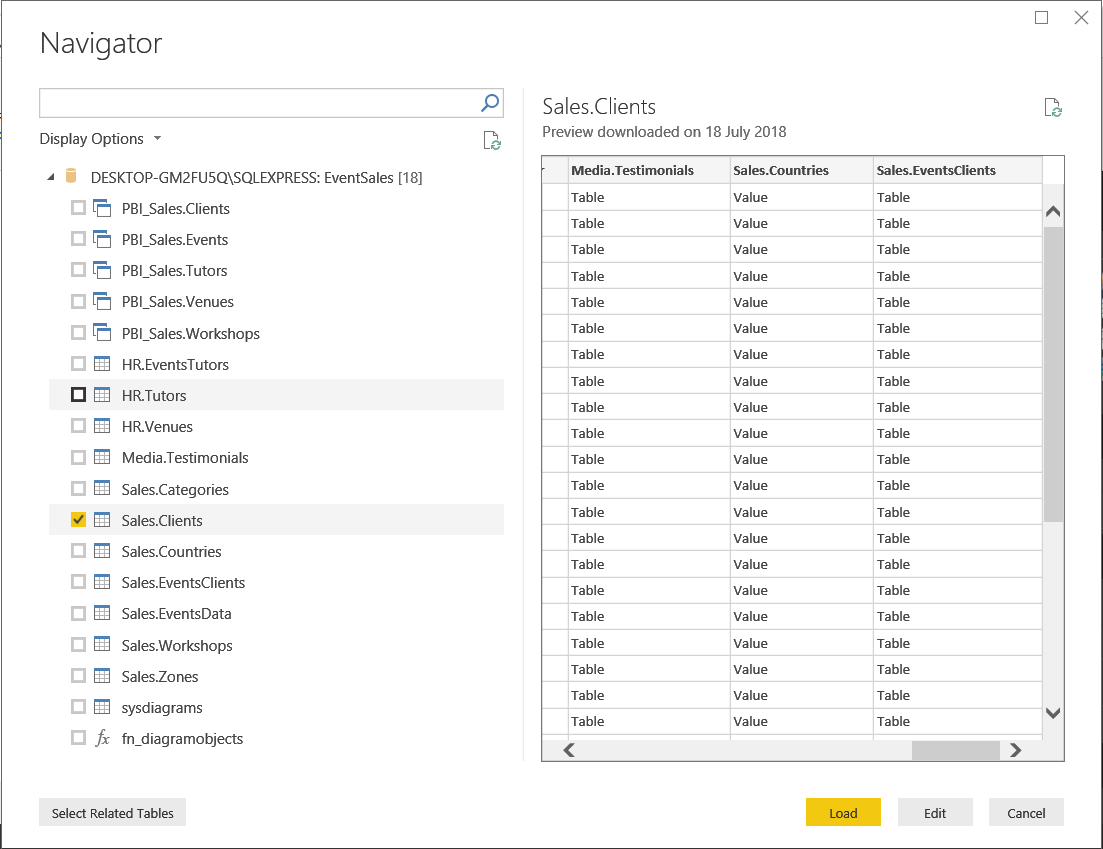
Click OK and, when the Navigator window appears, click in the checkbox next to the Sales.Clients table. On the right of the dialog, you will notice that in addition to the four columns which the table actually contains three extra columns are displayed (Media.Testimonials, Sales.Countries, and Sales.Zones), in other words, one column for each of the three tables directly linked to Sales.Clients.
Click the Edit button to import the data into the Query Editor.
Since we won’t need to bring in any data from the Sales.EventsClients table, let us delete that column.
Click on the expand button on the right of the Media.Testimonials column heading; and activate just the DateFilmed and VideoURL columns.
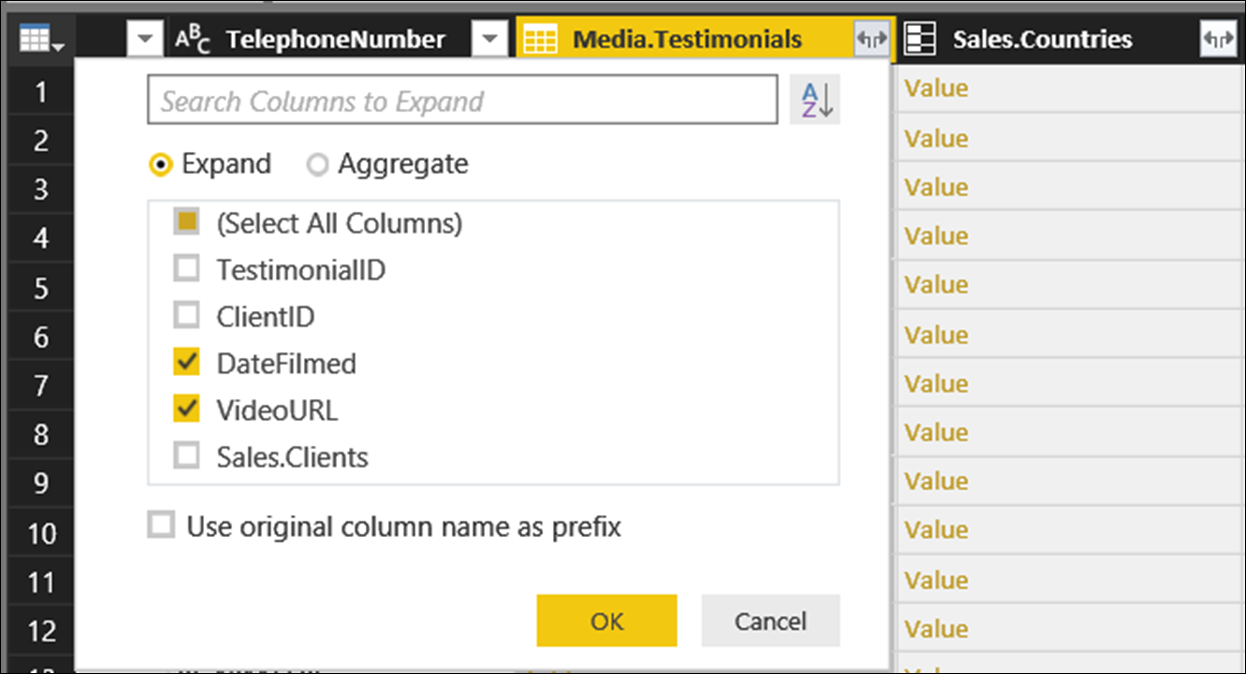
This gives us two new columns called DateFilmed and VideoURL.
Now, click on the expand button on the right of the Sales.Countries column heading; and activate the CountryName column. However, in addition to the columns in Sales.Countries, you will notice that we also have binary columns which link to tables related to Sales.Countries, including the one that we need, which is Sales.Zones.
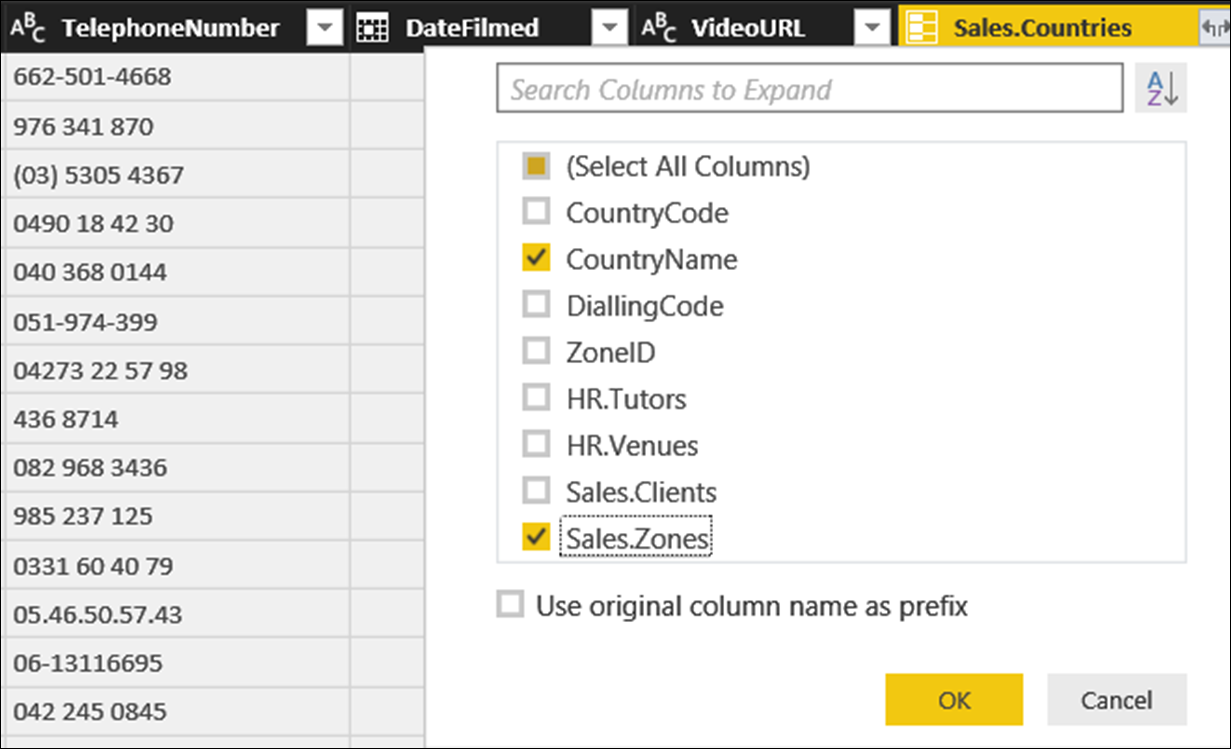
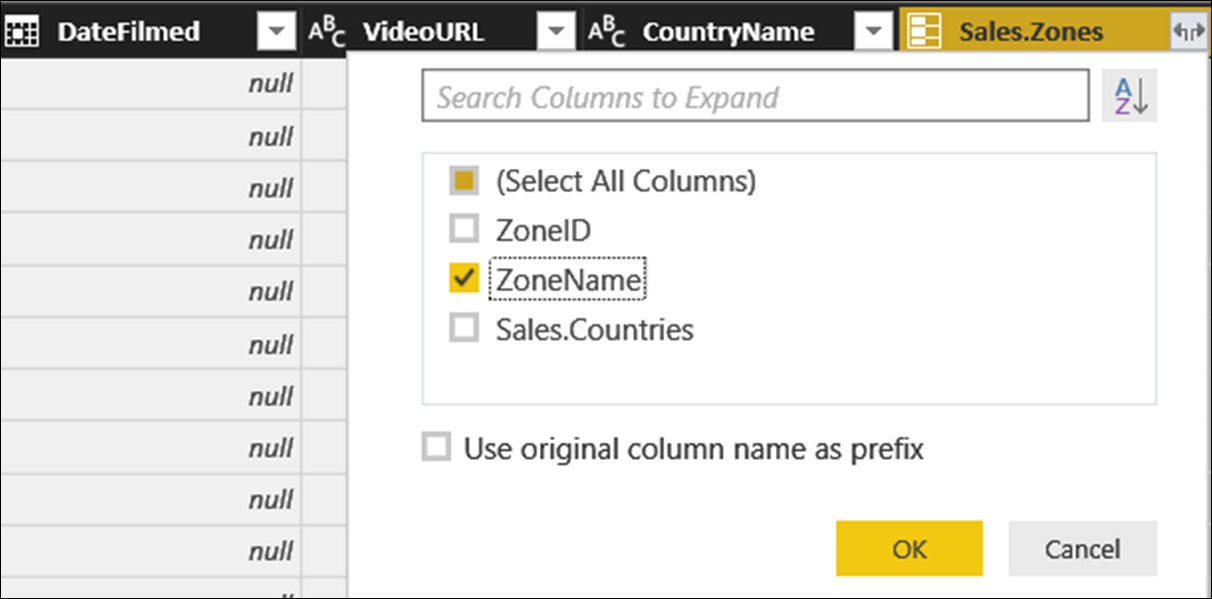
Activate Sales.Zones and click OK. Then, finally, click on the expand button on the right of the Sales.Zones; and activate the ZoneName column.
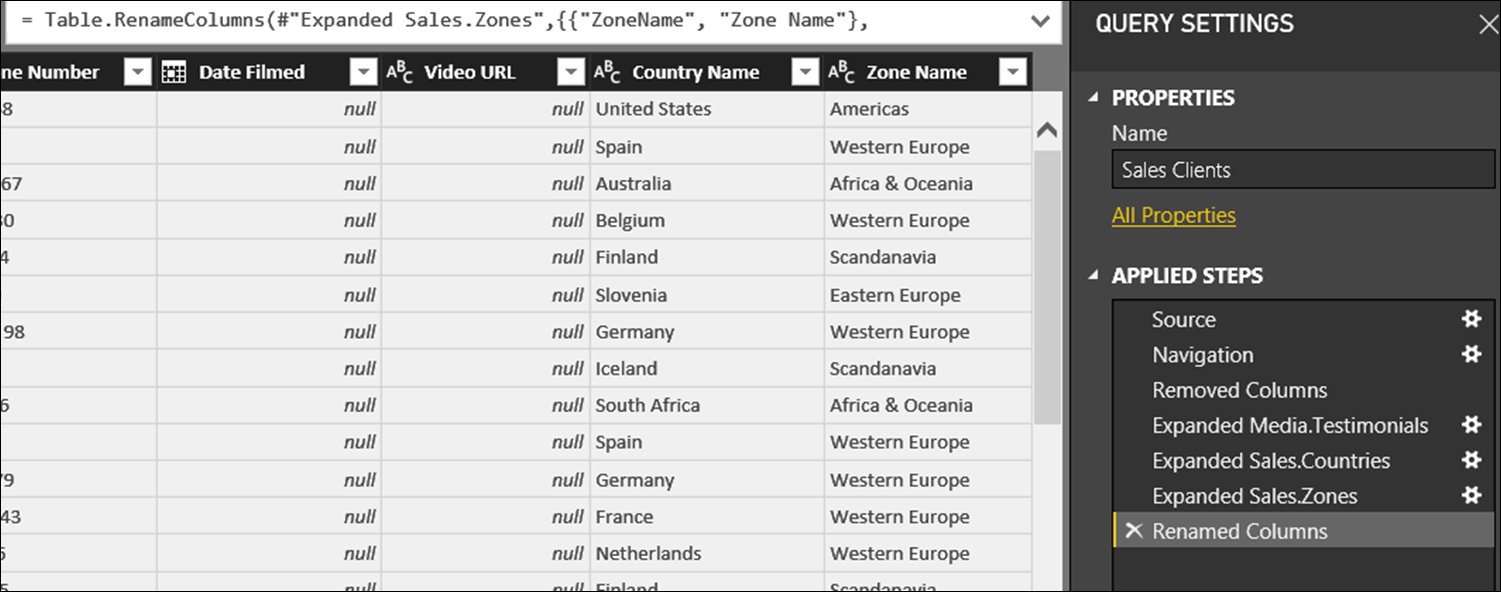
Click OK and we have all the columns that we need in our Clients table. We would then perform all of the Query Editor steps that we need, keeping an eye out to make sure that as many steps as possible can be query folded. (One of our first steps will probably be to rename the columns to make them more report-friendly.)
And so on, for the HR.Tutors, HR.Venues and Sales.Workshops tables…
In summary, when connecting to a relational database, if you are a DBA, then create a view corresponding to each of the tables that you need in your Power BI data model and connect to these views from Power BI.
If you are not a DBA, then you can leverage the Include relational columns and query folding features to achieve the same result from inside Power BI.